Day12-D3 的 Tooltips
本篇大纲:tooltips 基础设定、tooltips 进阶应用
今天我们要来讲解算是D3最轻松简单的 tooltips 啦!其实所谓的tooltips就是在触发事件时,加上一个 < text > 或 < div > 去建立想呈现的资讯框,我们先来看看以下的范例

Tooltips 基础设定
接着来看看程序码吧~现在画面上有一个绿色圆点点
// html
<div class="tooltip1"></div>

//js
const svg = d3.select('.tooltip1')
                .append('svg')
                .attr('width', 300)
                .attr('height', 300);

// 圆点点
svg.append('circle')
   .attr("id", "dot")
   .attr("cx", 150)
   .attr("cy", 150)
   .attr("r", 40)
   .attr("fill", "#69b3a2");
我们先来建立 tooltips
const tooltip = d3.select(".tooltip1")
      .append("div")
      .style("position", "absolute")
      .style("visibility", "hidden") // 一开始tooltips是隐藏的
      .style("background-color", "white")
      .style("border", "solid")
      .style("border-width", "1px")
      .style("border-radius", "5px")
      .style("padding", "10px")
      .html("<p>我是tooltip!</p>"+
             "<p>这边可以随意放入任何想放的资料</p>"+
            "<img src='https://github.com/holtzy/D3-graph-gallery/blob/master/img/section/ArcSmal.png?raw=true'></img>"+
            "<p>甚至图片也可以唷</p>");
接着再设定要触发的事件:滑鼠滑过时要呈现tooltips并设定它的位置,滑鼠移开时tooltips则消失
// 加上滑鼠事件
d3.select('#dot')
  .style('cursor', 'pointer')
  .on('mouseover', function() {
      return tooltip.style("visibility", "visible")
    })
  .on("mousemove", function() {
      // 设定 tooptip位置
      return tooltip.style("top", "250px").style("left","280px")
    })
  .on('mouseleave', function(){
      return tooltip.style("visibility", "hidden")
     });
这样就完成啦~~是不是很简单!但这个只是最基础的范例,我们接着再来做点进阶的tooltips范例吧!
Tooltips 进阶应用
现在我们不只有一个圆点点,而是有一整组资料要绑定到svg上,程序码如下:
// html
<div class="tooltip2"></div>
//js
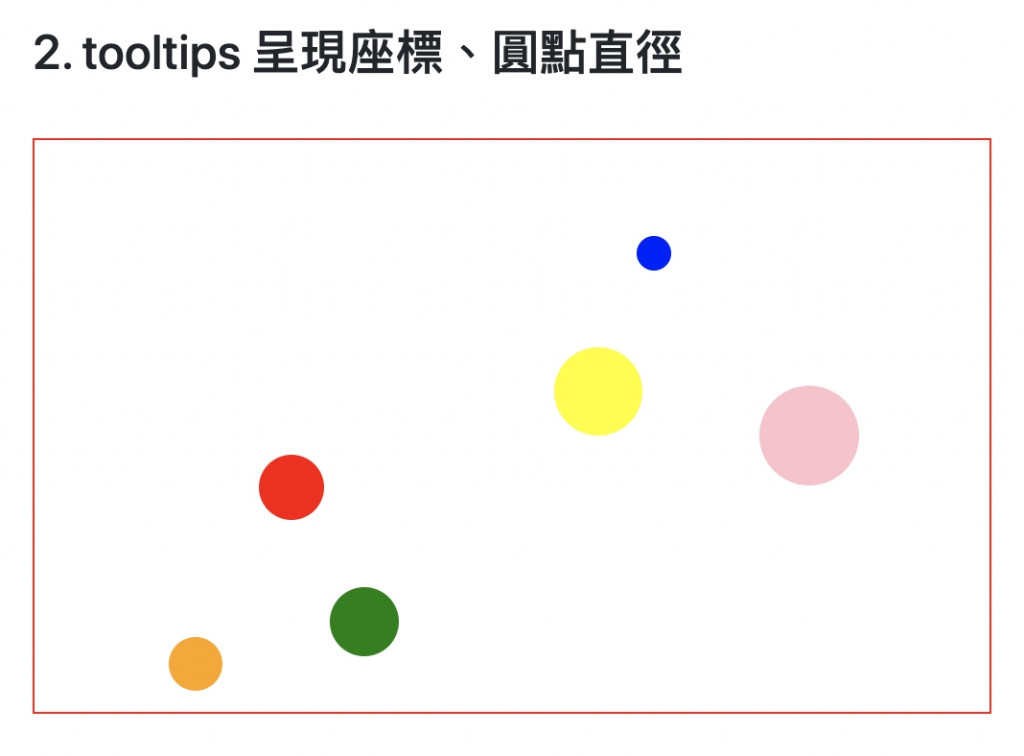
const tooltipsData =[
{'r': 17 , 'x': 134, y: 181, 'color':'red'},
{'r': 23 , 'x': 294, y: 131, 'color':'yellow'},
{'r': 14 , 'x': 84, y: 273, 'color':'orange'},
{'r': 9 , 'x': 323, y: 59, 'color':'blue'},
{'r': 18 , 'x': 172, y: 251, 'color':'green'},
{'r': 26 , 'x': 404, y: 154, 'color':'pink'}
]
我们先将资料转换成画面上的圆点点
d3.select('.tooltip2').style('position', 'relative')
const dots = d3.select('.tooltip2')
                      .append('svg')
                      .attr('width', 500)
                      .attr('height', 300)
                      .selectAll('circle')
                      .data(tooltipsData)
                      .enter()
                      .append('circle')
                      .attr('r', d => d.r)
                      .attr('cx', d => d.x)
                      .attr('cy', d => d.y)
                      .attr('fill', d => d.color)
                      .style('cursor', 'pointer');
这样一来画面上就多了六个大小、颜色、位置都不同点点啦
再来,我们要在滑鼠hover上圆点点时,显示此圆点点的半径。先来建立要显示资讯的tooltips
// 建立tooltips
  const tooltips = d3.select(".tooltip2")
                    .append("div")
                    .style("opacity", 0)
                    .style('position', 'absolute')
                    .attr("class", "tooltip")
                    .style("background-color", "white")
                    .style("border", "solid")
                    .style("border-width", "2px")
                    .style("border-radius", "5px")
                    .style("padding", "5px")
接着来设定圆点点的 mouseover 、mousemove 事件,让滑鼠hover过去时,tooltip 显示在我们设定好的位置上
dots.on('mouseover', function(){
         tooltips.style("opacity", 1) // 显示tooltip
       })
       .on('mousemove', function(d){
        let pt = d3.pointer(event, this) // 抓圆点位置
        tooltips.style("opacity", 1)
                .style('left', pt[0]+30+'px'). // 设定tooltips位置
                .style('top', pt[1]+'px')
                .html('圆半径:' + d.target.__data__.r) // 抓到绑定在DOM元素的资料
       })
这边的设定比较复杂,我们一一来解释一下:
-
d3.pointer ⇒ (如果不知道这个方法是什麽,请去看前面在讲事件的篇章)
使用这个方法先抓到此圆点的xy轴位置,接着再把圆点的x轴位置多加个30xp并设定给tooltip,这样一来tooltip就会出现在圆点的右方30px方位;y轴也是使用一样的逻辑去设定 -
html 圆半径 ⇒
我们把圆点绑定的参数d 带入 mousemove 事件,接着透过 d.target._data_ 去抓到绑定在DOM元素上面的 r 资料,这样一来就能顺利取得圆点的半径了
完成的效果就是这样:

接着还差最後一步~我们希望滑鼠移走时,tooltips会跟着消失,因此要设定 moseleave 时隐藏tooltips
dots.on('mouseover', function(){
         tooltips.style("opacity", 1)
       })
       .on('mousemove', function(d){
        let pt = d3.pointer(event, this)
        tooltips.style("opacity", 1)
                .html('圆半径:' + d.target.__data__.r)
                .style('left', pt[0]+30+'px')
                .style('top', pt[1]+'px')
       })
       .on('mouseleave', function(){. //设定滑鼠离开时tooltips隐藏
        tooltips.style("opacity", 0)
       });
这样就完成啦!

透过动态添加 tooltips,我们就能用事件互动的方式呈现更多图表资讯。今天就先讲到这边啦,之後的范例也会示范更多tooltips的用法~
Github Page 图表与 Github 程序码
这边附上本章的程序码与图表 Github 、 Github Page,需要的人请自行取用~
1.5 Design System - 可以先参考哪些设计系统
「最後的演讲」~ Randy Pausch 这是一本高中体育老师推荐的书,里面有件事影响我蛮多 那...
Day20 样式变化(动画4)
元件间的转换 在元素间的转换可以更加简单,,因为有了这一个动态组件 当按下单选键A会出现Compon...
## Day28 LineBot models小介绍
在linebot之中有提供几种讯息格式, Location Imagemap Template 现在...
参赛动机、系列文规划
参赛动机 原本是职缺是应徵网页前端工程师,因为公司目前需要有人帮忙写 App ,就被推坑一起写 Fl...
【没钱买ps,PyQt自己写】Day 1 - 安装 PyQt,建立自己的第一支 PyQt5 程序
前言 今年算是拖到最後一天最後一刻才开赛... 因为疫情的关系今年实在有点忙不过来, 因此早在两个月...