Day12 职训(机器学习与资料分析工程师培训班): Python程序设计
今天教学Numpy & Pandas & Matplotlib
import pandas as pd
number = pd.Series([11, 12, 30, 15, 22, 17])
name = pd.Series(['John', 'Mary', 'Amy' , 'Paul'])
tel = pd.Series(['04-22851549', '04-22851410', '04-22850266'])
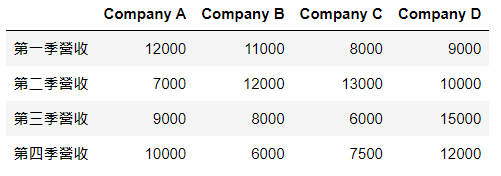
df = pd.DataFrame([[12000, 11000, 8000, 9000],[7000,12000,13000,10000],[9000,8000,6000,15000],[10000,6000,7500,12000]],columns = ['Company A', 'Company B', 'Company C', 'Company D'], index=['第一季营收', '第二季营收', '第三季营收', '第四季营收'])
df
# 将DataFrame储存成csv档
df.to_csv('test.csv')

# 载入csv档
test = pd.read_csv('test.csv')
test
# 将资料画成图
import matplotlib.pyplot as plt
x = [1, 2, 3]
y = [4, 5, 6]
fig, axes = plt.subplots()
axes.set_xlabel('X')
axes.set_ylabel('Y')
axes.plot(x, y, label = 'test')
axes.legend(loc='upper left')

plt.show()

Day17 参加职训(机器学习与资料分析工程师培训班),Python程序设计
练习使用selenium来登入FB from selenium import webdriver d...
DAY15: HTTP GET请求
今天要介绍的有点偏向处理HTPP请求的後续,在Web开发中,HTTP请求中最常用的就是Get与Pos...
[DAY17] 关於 DAL 的一些问题
Q: 为甚麽原本 ActiveRecord 提供的 ORM 不用,要再包一层自己的 ORM? 在本系...
Mac OS用FortiClient无法连线
想请问大家现在是否因为Mac OS安全性的关系?还是Forticlient的程序有改? Mac OS...
找LeetCode上简单的题目来撑过30天啦(DAY11)
今天好累,直接上题目 题号:36 标题:Valid Sudoku 难度:Medium Determi...