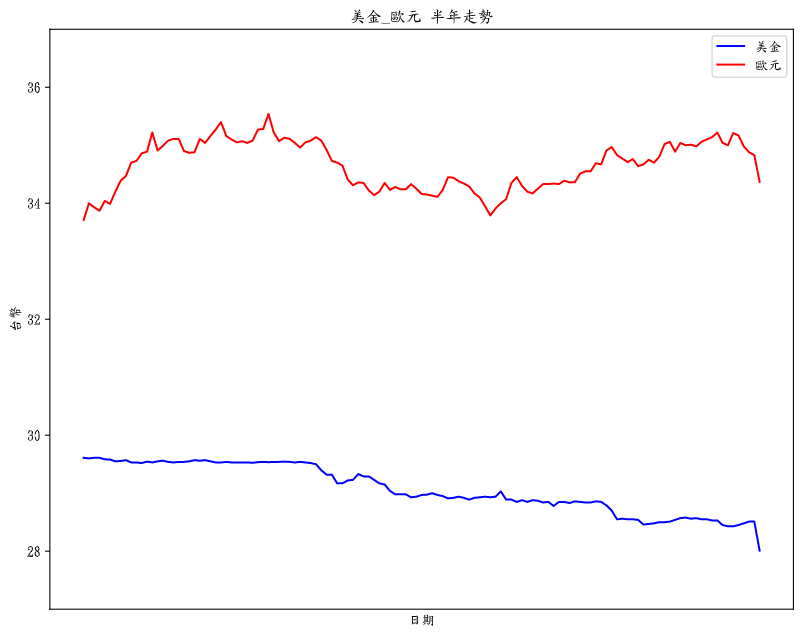
[python 爬虫] 美金_欧元 半年走势
import matplotlib.pyplot as plt
import requests
import bs4

aa="https://rate.bot.com.tw/xrt/quote/l6m/USD"
htmlcontent=requests.get(aa)
htmlcontent.encoding="utf-8"
obj=bs4.BeautifulSoup(htmlcontent.text,"html.parser")

dates=[]
ds1=obj.find_all("td",{"class":"text-center"})
for x in range(len(ds1)):
    if x%2==0:
        dates.append(ds1[x].text)

us_price=[]
ds2=obj.find_all("td",{"class":"rate-content-sight text-right print_table-cell"})
for x in range(len(ds2)):
    if x%2!=0:
        us_price.append(float(ds2[x].text))


aa="https://rate.bot.com.tw/xrt/quote/l6m/EUR"
htmlcontent=requests.get(aa)
htmlcontent.encoding="utf-8"
obj=bs4.BeautifulSoup(htmlcontent.text,"html.parser")

eur_price=[]
ds3=obj.find_all("td",{"class":"rate-content-sight text-right print_table-cell"})
for x in range(len(ds3)):
    if x%2!=0:
        eur_price.append(float(ds3[x].text))


dates.reverse()
us_price.reverse()
eur_price.reverse()

font={"family":"DFKai-SB"}
plt.rc("font",**font)

fig = plt.figure()
plt.plot(dates,us_price,color="blue",label="美金")
plt.plot(dates,eur_price,color="red",label="欧元")
#plt.xticks(fontsize=6,rotation=90)
plt.xticks([])  # 隐藏标签
plt.xlabel("日期")
plt.ylabel("台币")
plt.ylim(27,37)
plt.title("美金_欧元 半年走势")
plt.legend()

fig.set_figwidth(10)
fig.set_figheight(8)

plt.savefig('c:\\PP\\test.png')

plt.show()
Day 28 - 使用 CDK 创建 CloudWatch Alarm 的含图告警同时发送到 LINE 与 Discord
昨天教大家怎麽简单的在 LINE Notify 上面看到 CloudWatch 的 Alarm,不过...
【从零开始的Swift开发心路历程-Day14】打造自己的私房美食名单Part3(完)
昨天已经能让TableViewCell显示餐厅资料了 但....好像有点单调,让我们来加点餐厅的图片...
29/AWS SSA面试经验分享(下)
昨天已经介绍SSA的工作内容,还有面试关卡,今天想谈一下关於Amazon很强调的Star面试法跟他们...
从零开始-30日练习开发iOS APP-IQKeyboardManagerSwift Day-29
前言: IQKeyboardManagerSwift 可以在开发App时让 UITextField、...
Day 27 Celery
终於要进入 Celery 这个主题了,还记得我在 Day 24 说过介绍 Flask-Mail 的另...