EP28 - 使用 Container Insights 监控 EKS 上的容器,并整合 Grafana 作为仪表板
在 EP25 和 EP26,
我们为 EKS 配置了 Grafana 和 Loki,
让我们可以透过仪表板查看 Log,
虽然范例 AP 根本没有设定 Log,
今天我们将继续进行,
在 EKS 设定 Container Insights,
这样我们就可以查看容器的使用状况。
Container Insights
什麽是 Container Insights
CloudWatch 为 AWS 的监控工具
而 Container Insights(译作容器洞见)是 CloudWatch 的一个 feature
CloudWatch 会自动收集许多资源的指标
例如 CPU、记忆体、磁碟和网路
容器洞见还提供诊断资讯
例如容器重新启动故障
协助您快速隔离和解决这些故障
使用 Container Insights 的好处
在於你可以串接 AWS CloudWatch 的告警机制
并且 Grafana 也可以整合 AWS CloudWatch
可以使用 Grafana 统一做为内部系统监控的仪表板
为 EC2 Profile 添加权限
resource "aws_iam_role_policy_attachment" "ec2_profile_cloudwatch_agent_service" {
    policy_arn = "arn:aws:iam::aws:policy/CloudWatchAgentServerPolicy"
    role       = aws_iam_instance_profile.ec2_profile.name
}
快速入门使用 CloudWatch agent 和 Fluentd
记得将 aws-stage-cluster 替换成你的 cluster 名称
将 ap-northwast-1 替换成 cluster 所属区域
curl https://raw.githubusercontent.com/aws-samples/amazon-cloudwatch-container-insights/latest/k8s-deployment-manifest-templates/deployment-mode/daemonset/container-insights-monitoring/quickstart/cwagent-fluentd-quickstart.yaml | sed "s/{{cluster_name}}/aws-stage-cluster/;s/{{region_name}}/ap-northeast-1/" | kubectl apply -f -
设定 CloudWatch agent
建立新的资料夹
mkdir /vagrant_data/project/k8s-resources
cd /vagrant_data/project/k8s-resources
建立 namespace
kubectl apply -f https://raw.githubusercontent.com/aws-samples/amazon-cloudwatch-container-insights/latest/k8s-deployment-manifest-templates/deployment-mode/daemonset/container-insights-monitoring/cloudwatch-namespace.yaml
建立 serviceaccount
kubectl apply -f https://raw.githubusercontent.com/aws-samples/amazon-cloudwatch-container-insights/latest/k8s-deployment-manifest-templates/deployment-mode/daemonset/container-insights-monitoring/cwagent/cwagent-serviceaccount.yaml
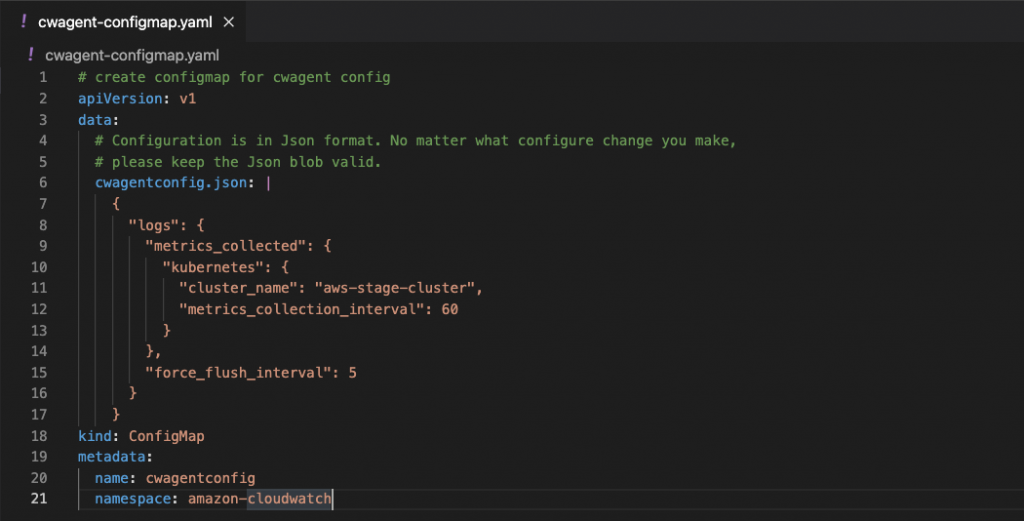
为 CloudWatch agent建立 ConfigMap
curl -O https://raw.githubusercontent.com/aws-samples/amazon-cloudwatch-container-insights/latest/k8s-deployment-manifest-templates/deployment-mode/daemonset/container-insights-monitoring/cwagent/cwagent-configmap.yaml
为 CloudWatch 代理程序建立 ConfigMap
编辑已下载的 YAML 档案
在 kubernetes 区块中的 cluster_name
将 {{cluster-name}} 取代为自己的丛集名称
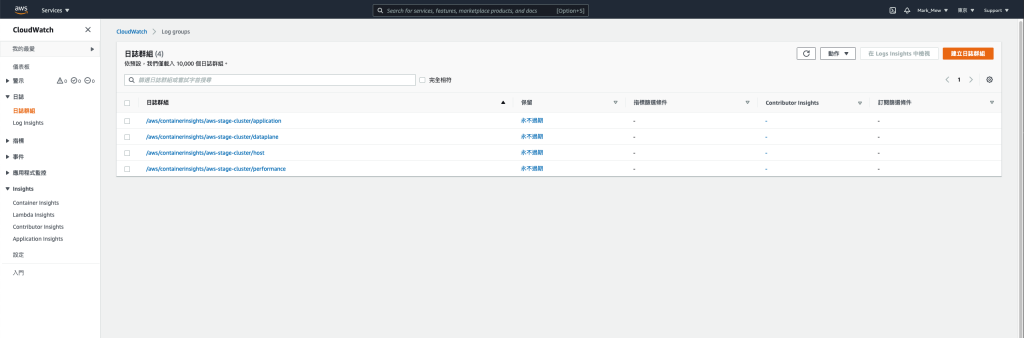
在 AWS Cloud Console 中检查设定
登入後会自动帮你建立四个日志群组
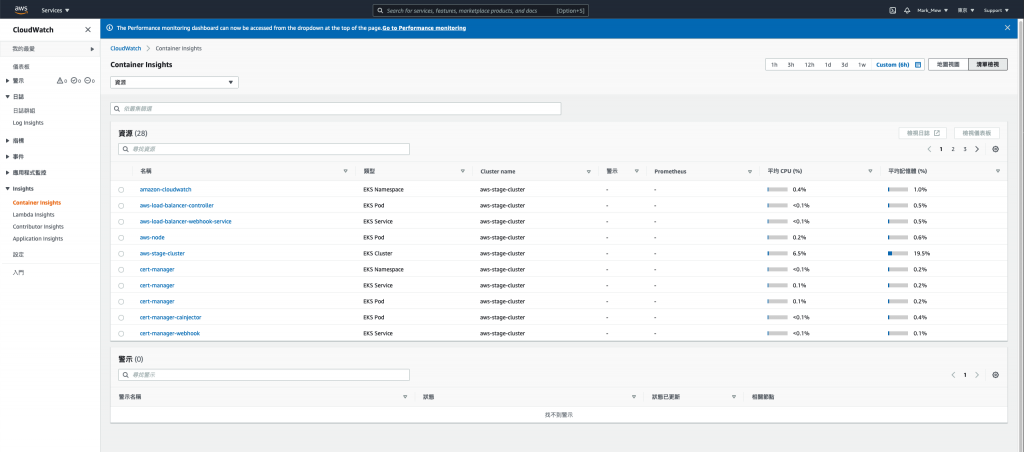
Container Insights 也可以根据 Pods、Namespace
去查看资源的使用状况
整合 Grafana
为 Grafana 建立 IAM 使用者
stage/main.tf
resource "aws_iam_user" "grafana" {
    name = "Grafana"
    path = "/"

    tags = {
        Name    = "Grafana"
        Usage   = "Grafana"
        Creator = "Terraform"
    }
}

resource "aws_iam_access_key" "grafana" {
    user = aws_iam_user.grafana.name
}

resource "aws_iam_user_policy" "grafana_cloudwatch" {
    name = "GrafanaCloudWatchLimited"
    user = aws_iam_user.grafana.name

    policy = <<EOF
{
  "Version": "2012-10-17",
  "Statement": [
    {
      "Action": [
        "cloudwatch:DescribeAlarmsForMetric",
        "cloudwatch:DescribeAlarmHistory",
        "cloudwatch:DescribeAlarms",
        "cloudwatch:ListMetrics",
        "cloudwatch:GetMetricStatistics",
        "cloudwatch:GetMetricData"
      ],
      "Effect": "Allow",
      "Resource": "*"
    },
    {
      "Action": [
        "logs:DescribeLogGroups",
        "logs:GetLogGroupFields",
        "logs:StartQuery",
        "logs:StopQuery",
        "logs:GetQueryResults",
        "logs:GetLogEvents"
      ],
      "Effect": "Allow",
      "Resource": "*"
    },
    {
      "Action": [
        "ec2:DescribeTags",
        "ec2:DescribeInstances",
        "ec2:DescribeRegions"
      ],
      "Effect": "Allow",
      "Resource": "*"
    },
    {
      "Action": "tag:GetResources",
      "Effect": "Allow",
      "Resource": "*"
    }
  ]
}
EOF
}
stage/outputs
output "grafana_secret_token" {
    description = "Decrypt access secret key command"
    value       = aws_iam_access_key.grafana.secret
    sensitive   = true
}
terraform apply
取得 IAM 密码
记起来等等会用到
terraform output grafana_secret_token
设定 datasource
画面左侧有的齿轮点下去
可以设定 datasource
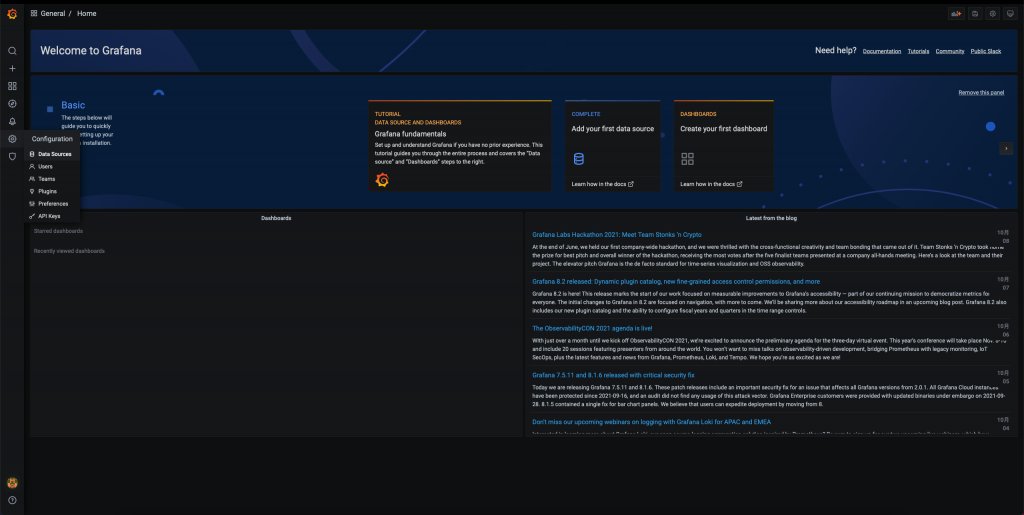
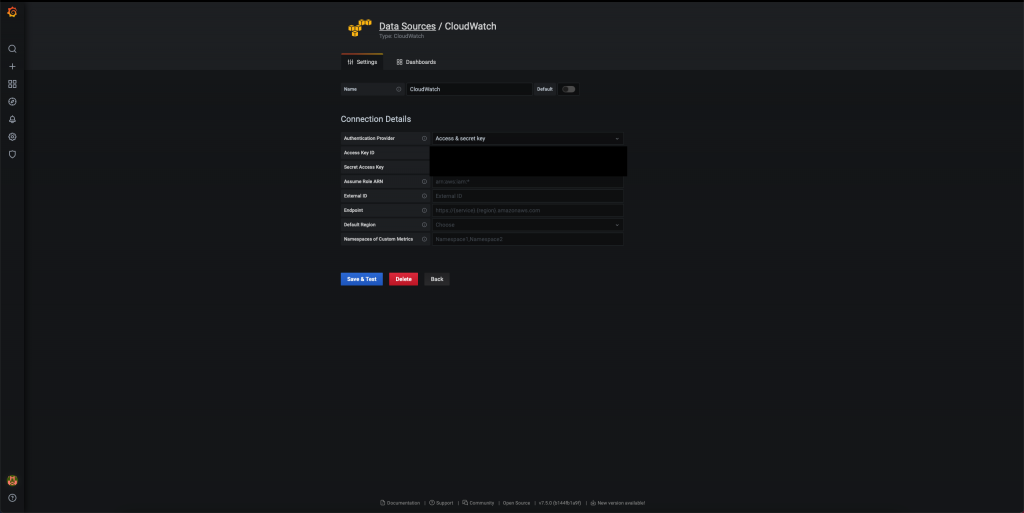
选择 CloudWatch
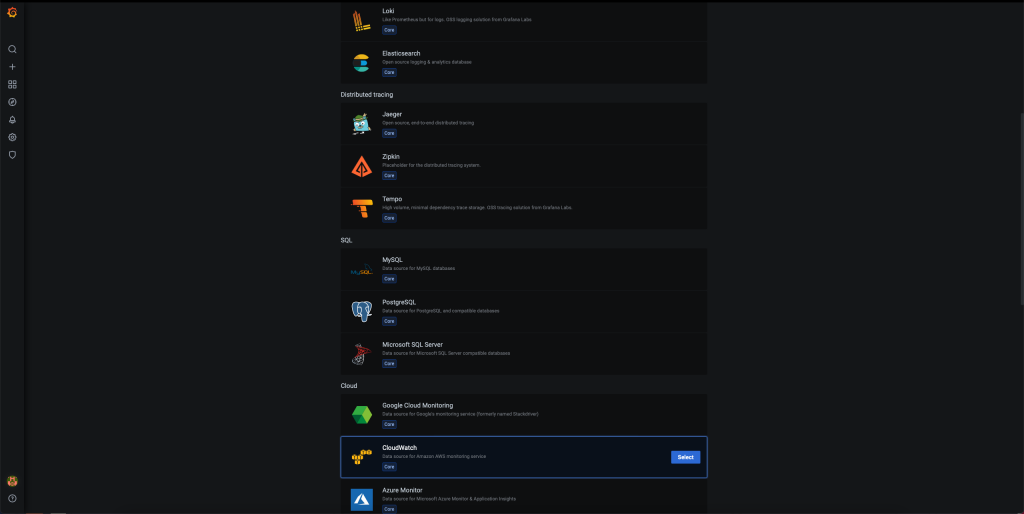
填入 IAM 资讯
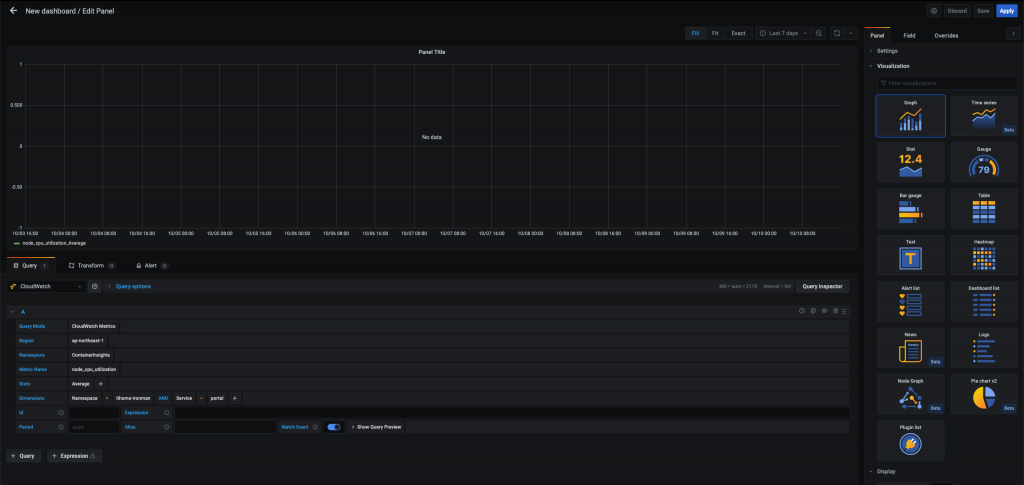
设定 Dashboard
Add Empty Panel 以後其实画面任意点选就可以出现了
需要注意的是 Grafana 的版本不能太旧(如:6.7版)
之前曾经不小心使用到太旧的版本
导致 CloudWatch Logs 无法正常显示
其实我们今天的快速设定
就已经间接的多使用到 fluetd 纪录 Log
并透过 CloudWatch Agent 转发到 CloudWatch Log 上
会考虑这样无脑的使用
则是因为 Log 存放时间的考量
当公司成长到一定规模
就会开始制定管理办法
此时 Log 的管理就会是个问题
今天将 Log 转发到 CloudWatch Log 上
可以将 Log 长久的保存下来
也可以维持 Log 的不可变更性
如果公司要取得一些认证
那 Log 的保存选择用 CloudWatch 会是个不错的选择
参考资料:
<<: [Day 26] - 『转职工作的Lessons learned』 - Cube.js(II)
英雄列表范例:删除英雄
接下来介绍「删除英雄」的实作方法。 删除介面设计 我规划是在每个项目後面增加一个删除按钮,按下该按钮...
Day-27 Memory Management
Memory Management tags: IT铁人 虽然我们在前面的计算机结构也有讲过Memo...
Day22 Vue 认识Porps(1)
在之前的铁人赛中我们知道了元件的实体状态、模板等作作用范围都应该要是独立的,意味这子元件是无法修改父...
VM 执行个体 (一)
GCE 如何在GCP上建立,如同以往机房建立Server的实体VM,在GCP上提供了三种方式,其中最...
k8s prometheus 监控多个MySql -盖完後的新增
【YC的寻路青春】 上一篇已经有点太多了 容许我分两篇 不然有点爆炸 如果盖完之後 要增新的话 1....