D3JsDay21笔画面量彩色图,涂色彩亮面画笔—地理面量图(下)
画出地图
昨天的步骤已经将资料整理得差不多了,接下来要进行画图与先前的步骤一样使用<path>和已经筛选过的资料tainanGeojson来绘制地图。
程序码如下
  g.selectAll("path")
    .data(tainanGeojson)
    .join("path")
    .style('fill',"white")
    .style("stroke", "black")
    .style("stroke-width",".25")
    .style("stroke-opacity",".5")
    .attr("d", path)
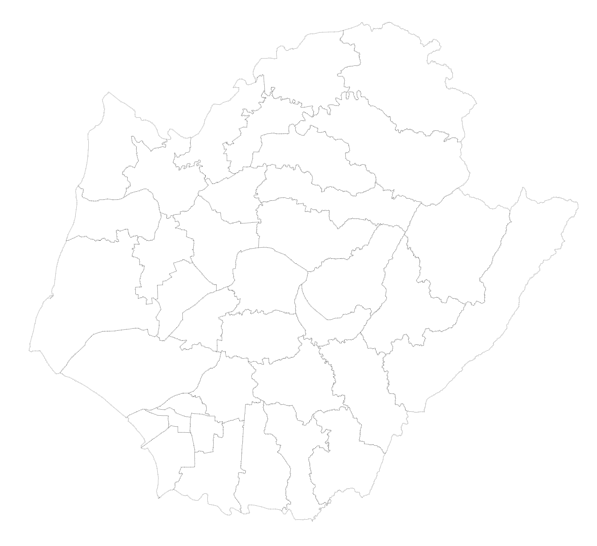
这个时候你应该可以看到画出了台南市的地图如下
填入地图色彩
接来我们要进行上色,因此在上色之前我们必须找到一个数字映射到颜色的函式用来转换不同颜色所表示的数字大小,因此这里一样使用d3.scaleSequential来做转换,先前说明过这个转换函式给定domain([数字,数字])会转换0~1的数字范围,由於我们要绘制的是土地房屋每平方公尺平均价格的分层设色图,所以我们就以最大值和最小值当domain值
程序码如下
let maxNum = d3.max(tainanGeojson,(d)=>(d.properties.HOUSEPRICE));
let minNum = d3.min(tainanGeojson,(d)=>(d.properties.HOUSEPRICE));
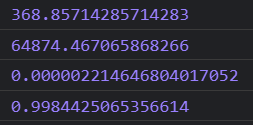
console.log(minNum);
console.log(maxNum);
console.log(d3.scaleSequential().domain([minNum, maxNum])(369));
console.log(d3.scaleSequential().domain([minNum, maxNum])(64774));
可以使用console.log来观看转换过程有没有问题
因此接下来我们选出一个颜色范围放入scaleSequential()
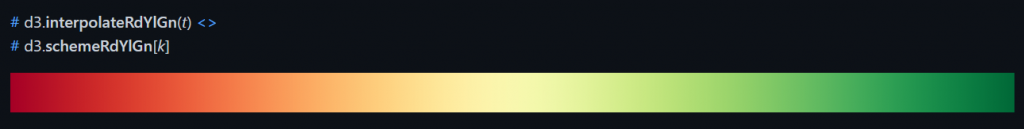
如上图官方scaleSequential说明中,除了上次提到可以在scaleSequential()放入自行转换函数以外,API另个说明也可以带入d3-scale-chromaticAPI里面的Diverging中的颜色
这里我们取interpolateRdYlGn这个插值器
因此使用fill填色的时候加入转换函数来将价格高低转换成颜色
另外值得一提的是宣告转换函数的时候,这边希望是房价土地平均价数字高的呈现红色、数字低的呈现绿色,因此颜色转换函数的domain()使用maxNum做为下限,minNum做为上限
程序码如下
let maxNum = d3.max(tainanGeojson,(d)=>(d.properties.HOUSEPRICE));
let minNum = d3.min(tainanGeojson,(d)=>(d.properties.HOUSEPRICE));
let redGreen = d3.scaleSequential(d3.interpolateRdYlGn).domain([maxNum, minNum]);
g.selectAll("path")
.data(tainanGeojson)
.join("path")
.style('fill',"white")
.style("stroke", "black")
.style("stroke-width",".25")
.style("stroke-opacity",".5")
.attr("d", path)
.style("fill",d=>(redGreen(d.properties.HOUSEPRICE)))
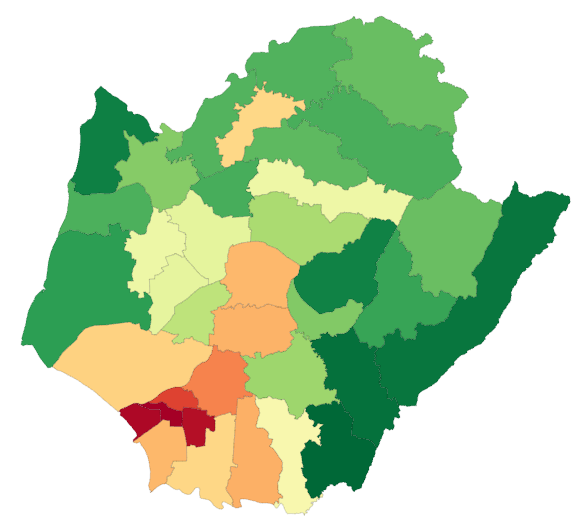
最後应该会呈现如下图
添加互动和动画
接下来我们希望添加一些互动来呈现地图内的详细资料,构想是使用tooltip来呈现内容,因此可以在滑鼠移到该区域的时候插入一个tooltip,其中tooltip内容的资料是来自於滑鼠移到该区域的资料,具体程序码如下
g.selectAll("path")
//与先前程序码雷同故省略
//与先前程序码雷同故省略
//与先前程序码雷同故省略
.style("fill",d=>(redGreen(d.properties.HOUSEPRICE)))
.on("mouseenter",function(e){
    let getTheDtName = d3.select(this).data()[0].properties.TOWNNAME;
    let getTheDtPrice = parseInt(d3.select(this).data()[0].properties.HOUSEPRICE);
    svg.append("g")
        .attr("id","tooltip")
        .html(`
<rect rx="4" x="${e.x}" y="${e.y}" width="100" height="75" style="fill:darkblue;"></rect>
<text font-weight="bold" style="fill:white;">
    <tspan x="${e.x+20}" y="${e.y+35}">${getTheDtName}</tspan>
    <tspan x="${e.x+20}" y="${e.y+55}">${getTheDtPrice}元</tspan>
    <tspan x="${e.x+45}" y="${e.y+70}" style="font-size:10px;">Avg:NT$/m²</tspan>
</text>
            `)
})
得取当前滑鼠移入的资料
我们宣告getTheDtName 来取得当滑鼠滑入该区域的时候所拥有的资料内容,由於先前已经绑定资料到元素上面,因此可以使用d3.select(this).data()来获取当前的被滑鼠滑入到的资料内容,其中要取得行政区域的名字则用物件取值的方式依序带入
getTheDtPrice宣告的变数与getTheDtName的方式大同小异,只不过我希望将显示整数就好,因此使用parseInt()来将小数点转换成整数。
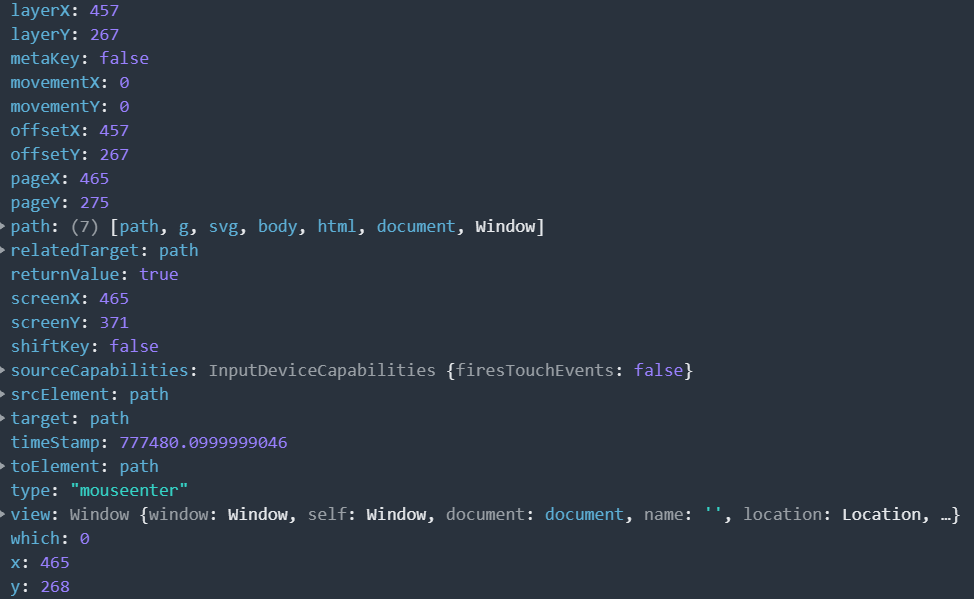
获取e的事件
.html()的函式里面使用样板字面值的方式显示,其中的e代表的是当滑鼠触发mouseenter的事件,我们可以尝试着console.log(e)来看看呈现什麽东西

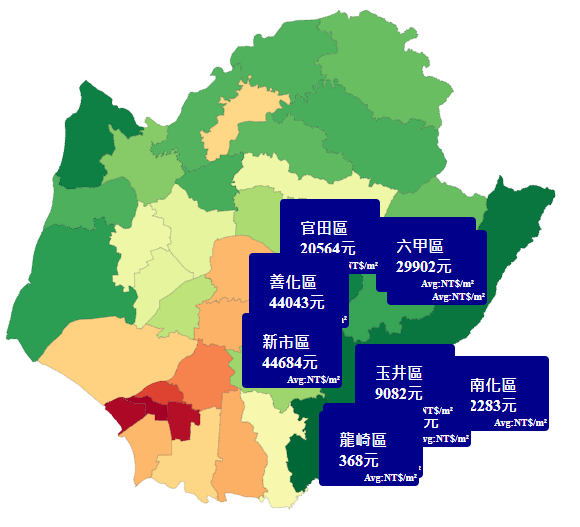
为了能够在svg里面换行,这边显示文字的方式使用<text>和<tspan>排列并对每一行文字的x和y位置调整,使用<rect>作为边框设计,这边设定一个id为tooltip以便滑鼠移出该区域的时候可以容易移除整个tooltip,到目前为止的显示画面如果你尝试着将滑鼠移入一些区域的时候应该会呈现如下图
接下来我们就加入滑鼠移出事件,由於先前已经有先设置id了,因此移除的时候会相对简单。
.on("mouseleave",function(e){
    svg.select("#tooltip").remove();
})
目前有一个小问题当产生出tooltip的时候滑鼠移到tooltip上面会再次重新触发mouseenter事件和mouseleave事件的状况,明明显示在同一个区域tooltip却一直显示→消失→显失→消失如下图
因此我们可以在css的地方加入pointer-events如下,将其设成none的话就不会成为滑鼠游标的目标,换句话说有点像是滑鼠事件看不到tooltip
svg #tooltip{
    pointer-events: none;
  }
为地图加入动画
我们可以在画面载入的时候依照房价由低到高填入到行政区域颜色,因此构想是先进行资料排序,然後接在transition()的时候,使用delay(),每次延迟的时间取决於资料的索引值来填充色彩。这边使用d3.sort来排列房价的低到高,函式里面指定要依照哪项资料排列,具体作法如下
const tainanGeojsonSort = d3.sort(tainanGeojson,d=>(d.properties.HOUSEPRICE));
g.selectAll("path")
.data(tainanGeojsonSort)
//中间省略
//中间省略
//中间省略
.on("mouseleave",function(e){
    svg.select("#tooltip").remove();
})
.transition().delay((d,i)=>(i*100))
.style("fill",d=>(redGreen(d.properties.HOUSEPRICE)))
这边设置100毫秒,另外提醒一下记得加入fill填色的话要把写在transition()之前的
fill给删除,动画才能正确执行。
完整程序码如下
let width = 1200;
let height = 675;
const projection = d3.geoMercator()
                    .center([120.24,23.18 ])
                    .scale(50000);
const svg = d3.select("body")
            .append("svg")
            .attr("width", width)
            .attr("height", height);
const path = d3.geoPath()
                .projection(projection);
const g = svg.append("g");
d3.json("taiwanDistrict.json")
    .then(function(topology) {
    const geojson =  topojson
                .feature(topology, topology.objects.TOWN_MOI_1100415)
                .features;
    const tainanGeojson = [];
    geojson.forEach(function(el) {
        if(el.properties.COUNTYNAME=="台南市"){
            tainanGeojson.push(el);
        }
    })
    d3.csv("taiwan109s4.csv")
    .then(function(csvData){
        console.log(csvData);
        const districtMap = d3.group(csvData, d => d["乡镇市区"]);
        console.log(districtMap);
        tainanGeojson.forEach(function(el){
            for (let [key, value] of districtMap) {
                if(key===el.properties.TOWNNAME){
                    el.properties.HOUSEPRICE= d3.mean(value, d=>d["单价元平方公尺"]);
                }
            }
        });
        const tainanGeojsonSort = d3.sort(tainanGeojson,d=>(d.properties.HOUSEPRICE));
        console.log(tainanGeojsonSort);
        let maxNum = d3.max(tainanGeojson,(d)=>(d.properties.HOUSEPRICE));
        let minNum = d3.min(tainanGeojson,(d)=>(d.properties.HOUSEPRICE));
        const redGreen = d3.scaleSequential(d3.interpolateRdYlGn).domain([maxNum, minNum]);

        g.selectAll("path")
        .data(tainanGeojsonSort)
        .join("path")
        .style('fill',"white")
        .style("stroke", "black")
        .style("stroke-width",".25")
        .style("stroke-opacity",".5")
        .attr("d", path)
        .on("mouseenter",function(e){
            let getTheDtName = d3.select(this).data()[0].properties.TOWNNAME;
            let getTheDtPrice = parseInt(d3.select(this).data()[0].properties.HOUSEPRICE);
            svg.append("g")
            .style("border",function(d){console.log(e)})
            .attr("id","tooltip").html(`
            <rect rx="4" x="${e.x}" y="${e.y}" width="100" height="75" style="fill:darkblue;"></rect>
                <text font-weight="bold" style="fill:white;">
                    <tspan x="${e.x+20}" y="${e.y+35}">${getTheDtName}</tspan>
                    <tspan x="${e.x+20}" y="${e.y+55}">${getTheDtPrice}元</tspan>
                    <tspan x="${e.x+45}" y="${e.y+70}" style="font-size:10px;">Avg:NT$/m²</tspan>
                </text>
            `)
        })
        .on("mouseleave",function(e){
            svg.select("#tooltip").remove();
        })
        .transition().delay((d,i)=>(i*100))
        .style("fill",d=>(redGreen(d.properties.HOUSEPRICE)))
实际效果如下
GithubPage如下
[2021铁人赛 Day13] General Skills 10
引言 今天会讲两题,因为第二题是我们讲过的,就当作复习吧! 第一题继续延伸进位制,第二题是已经出现...
Ruby on Rails 语言
https://wolkesau.medium.com/ruby-on-rails-语言-ba010...
予焦啦!问题分析
本节是以 Golang 上游 8854368cb076ea9a2b71c8b3c8f675a8e1...
[04] 认识服务器网址和请求
这是一个小专案并没有要使用express这样的服务器框架 所以需要自己制作路由功能 首先安装 nod...
DAY26 linebot结果展示-2
原本使用者没有管理员权限,当输入[我要成为管理员]後将资料库的Root设为1来代表使用者获得权限。...