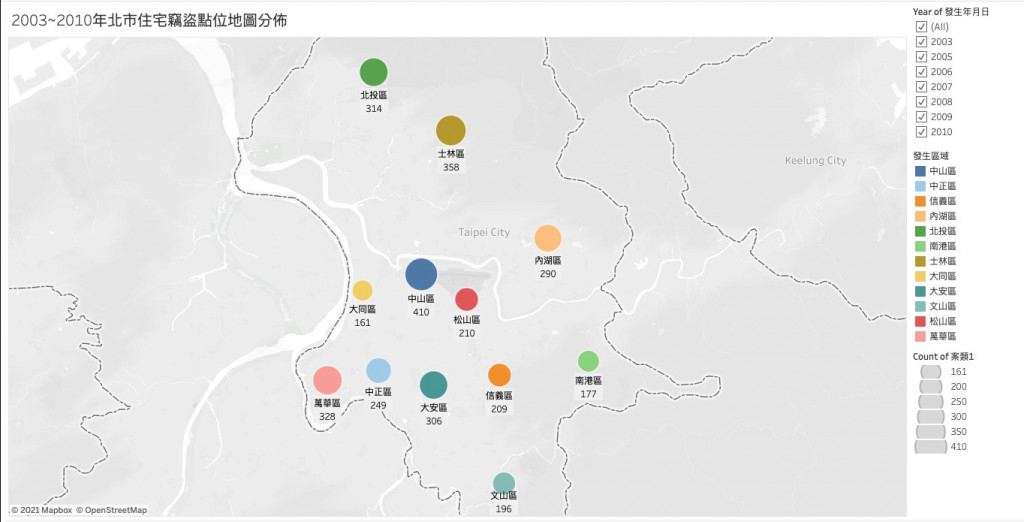
[Tableau Public] day 12:调整好原始资料就来制作地图分布吧
第12天,在原始资料中新增各个行政区的经纬度资料後,我们重新把原始资料载入到 tableau public 中。
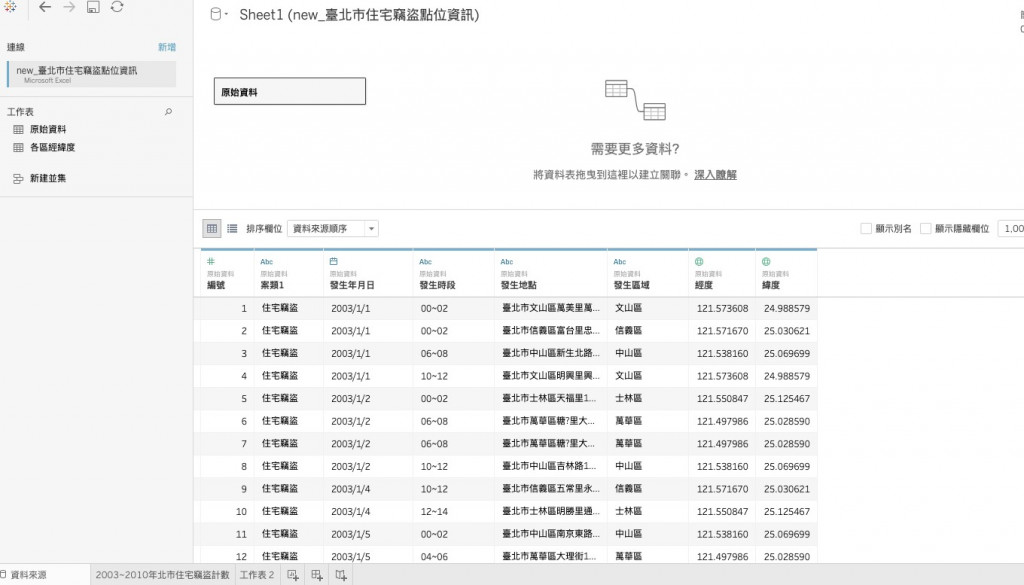
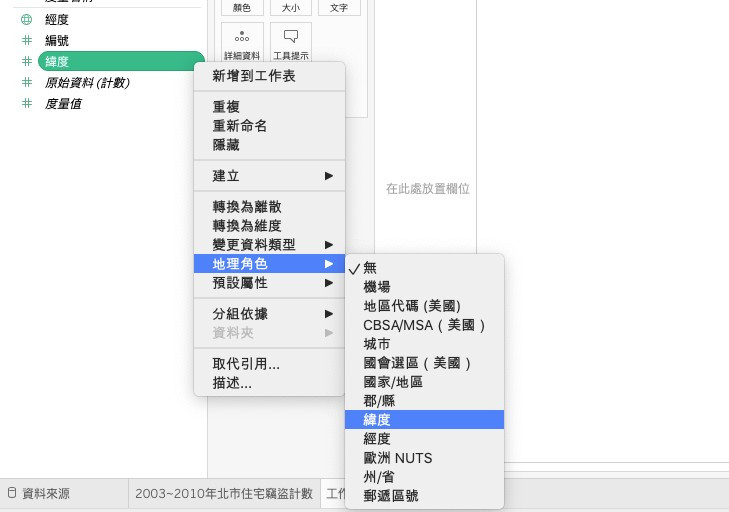
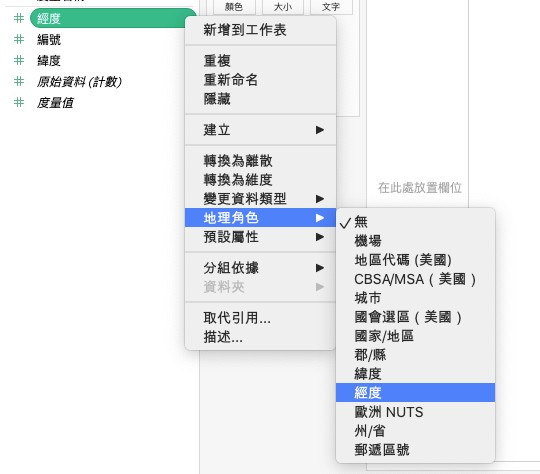
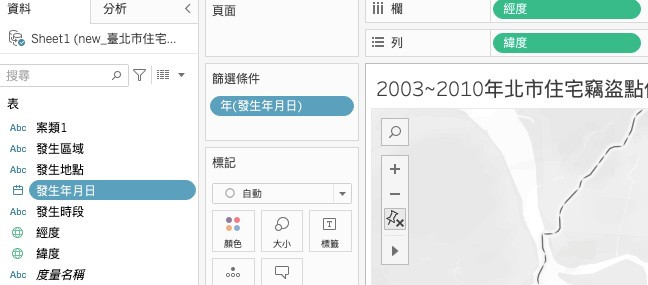
新增一张工作表,名称改为「2003~2010年北市住宅窃盗点位地图分布」,接着我们观察左边栏位的资讯,我们要先把昨天新增的「经度」、「纬度」栏位转换地理角色,「经度」栏位转为经度,「纬度」栏位转为纬度。
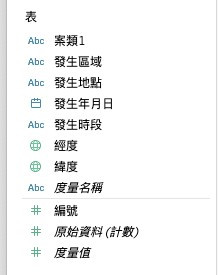
然後再把这两个栏位拖曳到灰线以上的维度区块,
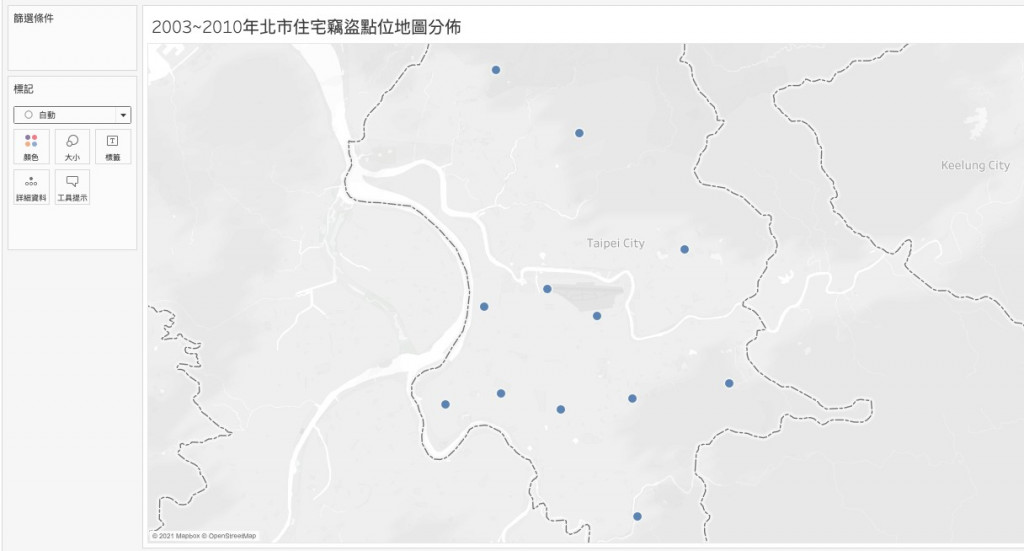
完成後,我们把「经度」拖曳到工作表的「栏」,「纬度」拖曳到「列」,如此就可以看到台北市各区已经被地图标示出来了。
下一步把:
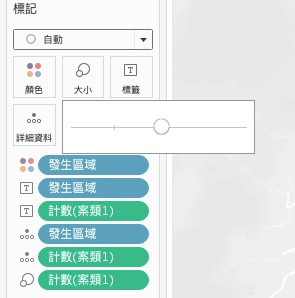
1.「发生区域」拖曳到颜色。
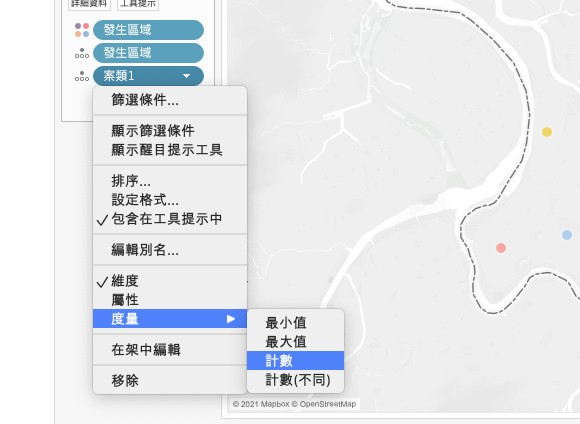
2.「发生区域」&「案类1」拖曳到详细资料,案类1记得改为「计数」。
3.「案类1」拖曳到大小,也要记得改为「计数」。
4.「发生区域」拖曳到标签。
5.「案类1」拖曳到标签,也要记得改为「计数」。
6.点击「大小」,拖曳到正中间。
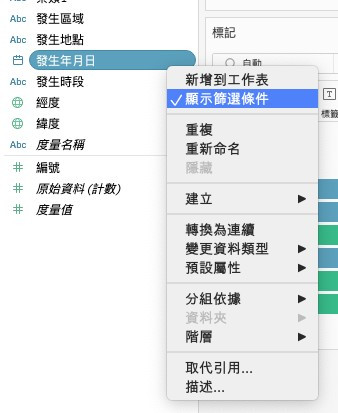
7.对「发生年月日」点右键,选择「显示筛选条件」,如此一来就可以在右方选单自定义选择指定年份的窃盗案发生总数。
最後就存档上传~今天轻松又写意!
创建App-Google sign in my App
创建App-Google sign in my App 本App设想登入方法有Google、Appl...
Day 27 - 不安全的登入机制
出於书本 Chapter 14. Web sites and Application 不安全的登入机...
DIY的规划
好穷喔,本来预计要买Oculus,因为看起来整个组合最便宜,但貌似台湾没代理商的样子,所以买不到,V...
Day 03 - Curry
yo, what's up? 今天要来介绍 Functional Programming 重要的概念...
#12-套件掰!用JS 做进场特效 (Intersection Observer API)
进场特效也是基本再基本的网页动态! 尤其是当网页内容塞太多时,适当地加上进场特效可以帮助使用者阅读重...