分布式可观测性 Metrics 浅谈
上篇回顾
分布式可观测性 Logging 浅谈
分布式可观测性 Structured Log
继续浅谈Observability的另1个基石
Metrics
在单体式架构上,主要的监控对象是OS与机器这物理节点, 所以经常直接使用OS自带的工具.
以Linux来说top来看每个Process的CPU使用率、记忆体用量, mpstat, vmstat, iostat等等的.
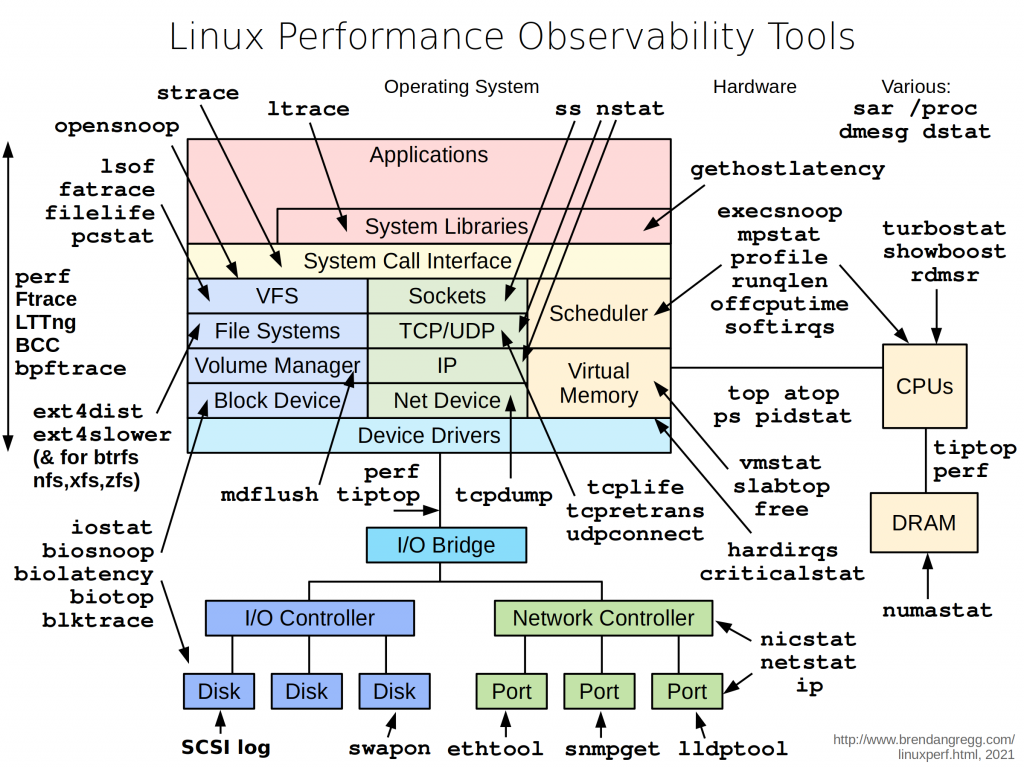
Windows则是Task manager.
透过这些OS提供的命令与工具来监控.
但在现在分布式架构下, 数十数百台机器或是在VM上的OS, 监控的可观测性成了挑战.
於是陆续诞生了Cacti、Zabbix、Prometheus等很多监控系统,
它们的特色是metrics数据的收集、数据的存放、数据的查询展示都分离开来. 彼此透过网路协议与介面来传递资料.
现在常见的架构有两种,
一种是数据的收集以Library形式, 与业务系统整合在程序专案中,
在程序码埋点的方式, 以Client调用的角度, 把调用资源或服务的耗时、请求量、慢查询量,
甚至能收集GC的资讯等等的送给另一个独立出来的数据处理服务去做处理与分析.
以Go来说, Prometheus就有提供这样的Library
Go自带的pprof其实也是一种
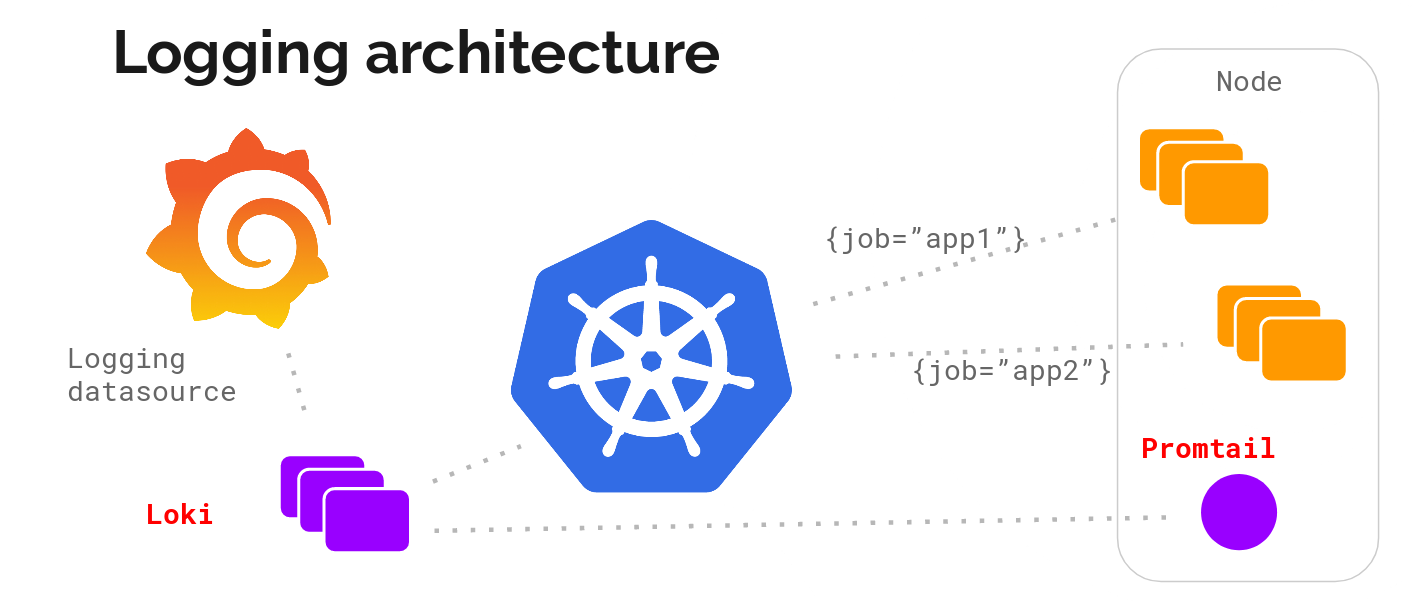
另一种则是以Agent(Sidecar)或Exporter形式, 由它来负责数据收集与数据做处理 .
通常它会负责采集特定指标资讯例如, 主机资讯, 或是各Process的CPU用量, 记忆体用量.
Prometheus提供非常多exporter来采集特定指标
之後要介绍的Fluent-bit或Promtail则是以Agent形式

5种常见的Metrics类型
这里主要依据Prometheus提供的Metric Types
-
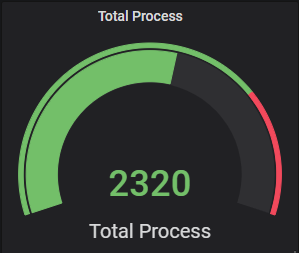
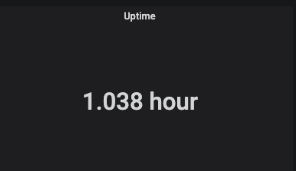
Gaugers : 一个数值, 表示瞬间状态
以下是Go定义的介面, 可以看到有+-1, 加减数字等方法
通常用来表示像是CPU目前使用率等等的当前状态的表示
type Gauge interface {
	Metric
	Collector

	// Set sets the Gauge to an arbitrary value.
	Set(float64)
	// Inc increments the Gauge by 1. Use Add to increment it by arbitrary
	// values.
	Inc()
	// Dec decrements the Gauge by 1. Use Sub to decrement it by arbitrary
	// values.
	Dec()
	// Add adds the given value to the Gauge. (The value can be negative,
	// resulting in a decrease of the Gauge.)
	Add(float64)
	// Sub subtracts the given value from the Gauge. (The value can be
	// negative, resulting in an increase of the Gauge.)
	Sub(float64)

	// SetToCurrentTime sets the Gauge to the current Unix time in seconds.
	SetToCurrentTime()
}
-
Counters : 计数器
就都只有增加的方法, 只增不减
常见就是HTTP Request总数量, 直到服务重启时, 才会重置为0
type Counter interface {
	Metric
	Collector

	// Inc increments the counter by 1. Use Add to increment it by arbitrary
	// non-negative values.
	Inc()
	// Add adds the given value to the counter. It panics if the value is <
	// 0.
	Add(float64)
}
-
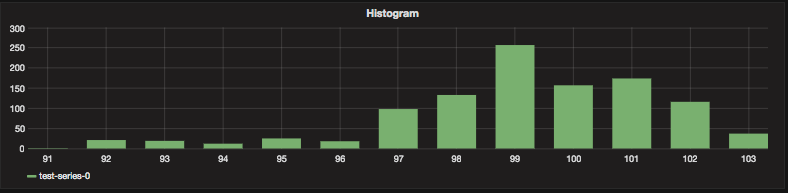
Histograms : 直方图
先预先设定好的数值范围与每个bucket的upper inclusive bound上边界, 来分别做计算.
例如bucket有[1,5],[6,10], 然後给了一组数据1、3、5、7、9
陆续把数值丢到自己落在该数值范围内的bucket, 这些数值丢入後, [1,5]有3个, [6,10]有2个
Histograms在意的是各bucket内的数量而已, 并不在意投入的数值本身.
因此它很适合高并发量的数据收集.以及清楚的展示分布情况.
通常是上线後一阵子或是有经验的前辈, 来告知数值范围来设定, 不然颇难知道上限跟数值区间.
常见就是HTTP Response time
type Histogram interface {
	Metric
	Collector

	// Observe adds a single observation to the histogram. Observations are
	// usually positive or zero. Negative observations are accepted but
	// prevent current versions of Prometheus from properly detecting
	// counter resets in the sum of observations. See
	// https://prometheus.io/docs/practices/histograms/#count-and-sum-of-observations
	// for details.
	Observe(float64)
}
-
Summary
Summary相较於Histograms也是透过Observe方法来采样, 但他是针对观察到的值, 真正进行计算与统计,
因为也没预先定义数值范围, 所以没有bucket这概念.
主要采取quantiles分位数, 符号φ(0 <= φ <= 1) 做统计
φ = 0.5表示中位数,
φ = 0.9表示90个百分位数
就能透过这summary得知所有采样数值内, 小於φ=0.5的有多少, 小於φ=0.9的有多少
type Summary interface {
	Metric
	Collector

	// Observe adds a single observation to the summary. Observations are
	// usually positive or zero. Negative observations are accepted but
	// prevent current versions of Prometheus from properly detecting
	// counter resets in the sum of observations. See
	// https://prometheus.io/docs/practices/histograms/#count-and-sum-of-observations
	// for details.
	Observe(float64)
}
本日小结
Metrics的强大在於几乎可以针对任意指标进行数值计算後, 决定展示或是通知报警.
至於到底要对什麽指标做监控. 这才是重要的思考点
也许有人想到Response time做监控, 只要系统回应时间逐渐变慢, 就报警通知
也许是针对错误日志发生的速率, 做计算後超过一个阀值做通知
也许是资源超过一个阀值, 做通知
Mettrics的设计也不是一蹴而就的, 要慢慢根据具体的需求变化反覆跌带来更新设计.
>>: [ 卡卡 DAY 22 ] - React Native 元件害羞之骨架屏先让你瞧 react-native-skeleton-placeholder
【Day23】导航元件 - Pagination
元件介绍 Pagination 是一个分页元件,当页面中一次要载入过多的资料时,载入及渲染将会花费更...
[Day20] Emmet 学习笔记 - 层级篇
预处理器可以透过加快撰写程序的速度,但是自己的打字速度提升有限(换了Mac之後还变慢不少),Emme...
#5. Q&A Section(原生JS版)、#2. Blurring Loading(Vue版)、#3. Expanding Cards(Vue版)
今日任务 1. Q&A Section (原生JS写法) Codepen Link: htt...
[Day 8] 整合 Koin DI 实作 Ktor Plugin
Ktor Plugin & DSL Ktor 的架构设计是让开发者透过实作 plugin,把...
Day 14 - 安装与执行 YOLO
Day 14 - 安装与执行 YOLO 在 介绍影像辨识的处理流程 - Day 10 有提到 YOL...