Day23 设定Alerts
今日我们要来使用Kibana内的警报功能,看如何设定Alert让我们能收到异常的通知。
设定Alert警报
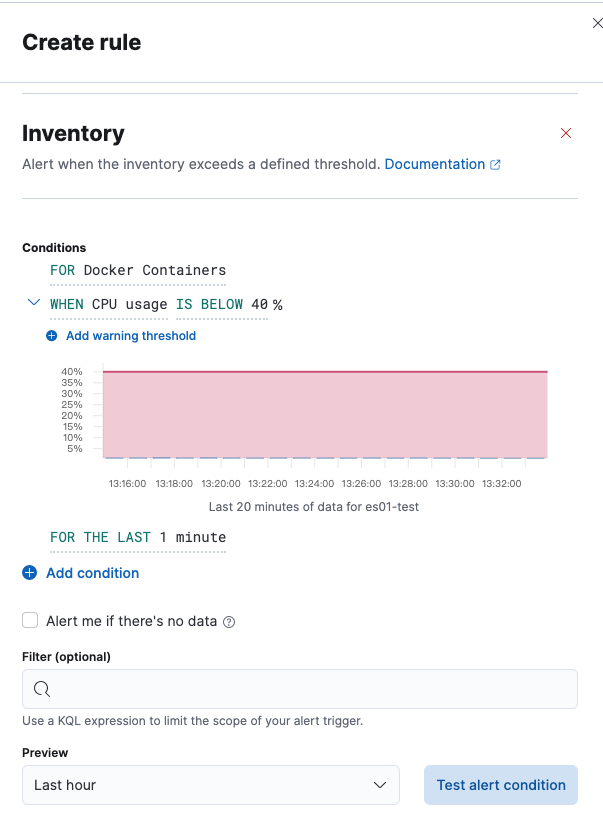
首先我们说明一下预计想做的警报器,功能说明: 每分钟检查机器的cpu值是否有小於40%。
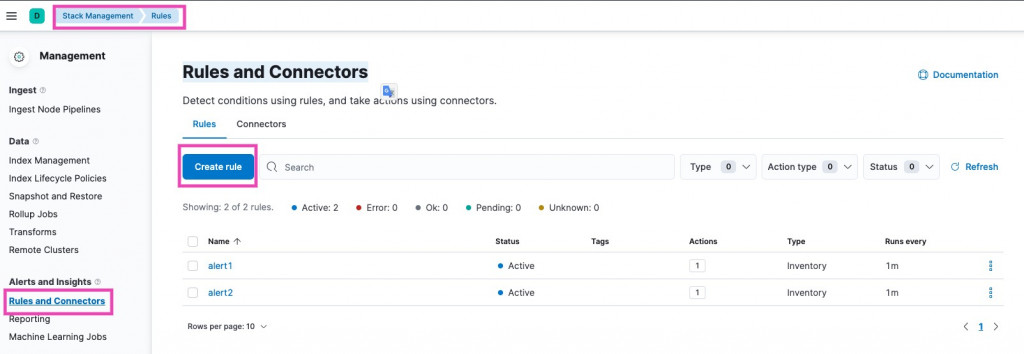
左选单 Stack Management後,选择Rules and Connectors,点选Create rule按钮,准备开始建立警报器。
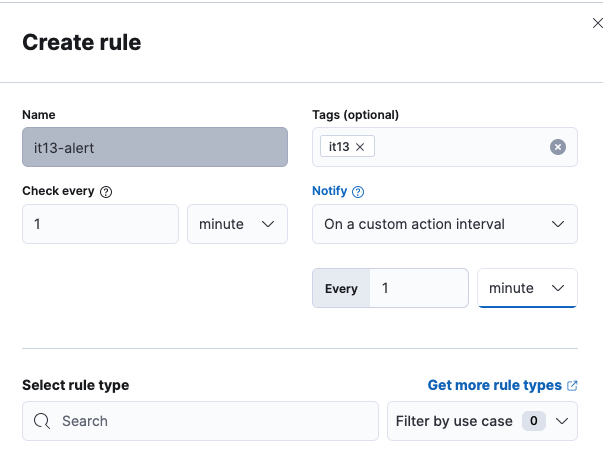
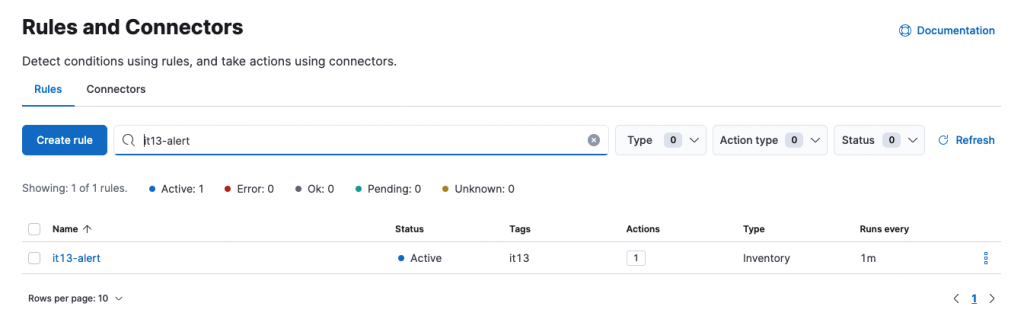
步骤一: 建立名称it13-alert的警报器,选择每分钟检查一次,并且每分钟通知。
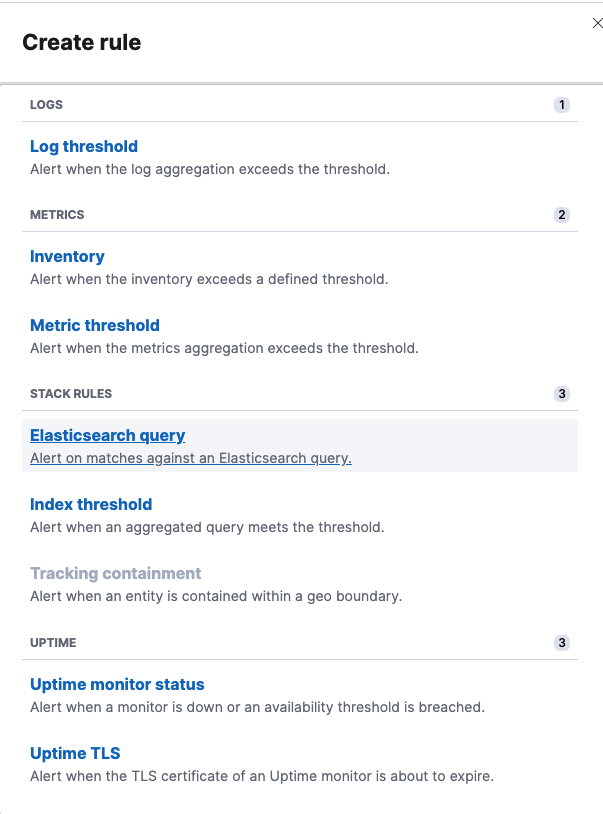
步骤二: 选择想要触发的类型:
- Log threshold
- Inventory
- Metric threshold
- Elasticsearch query
- Index threshold
- Tracking containment
- Uptime monitor status
- Uptime TLS
- Uptime TLS (Legacy)
步骤三:这里我们选Inventory,设定警报触发的条件。
步骤四:Actions设定,免费版本只有Index和Server log。
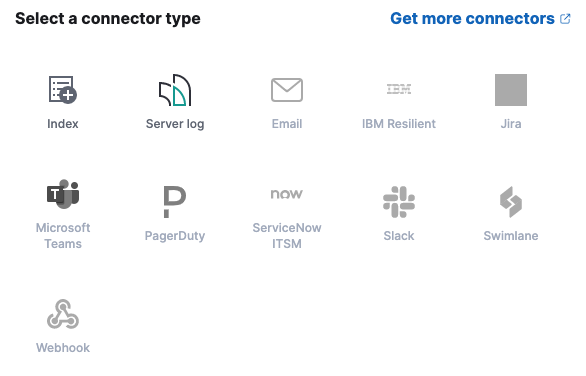
选择index当做警报发送,开始进Action设定。
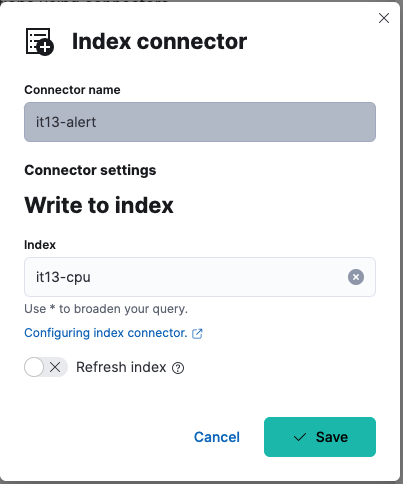
设定connector(it13-alert),建立写入索引名称it13-cpu。
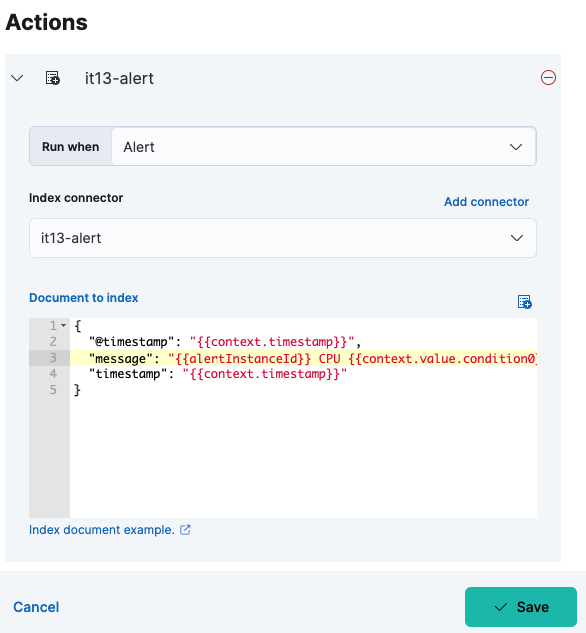
设定警报发送内容,警报样板格式
{
"@timestamp": "{{context.timestamp}}",
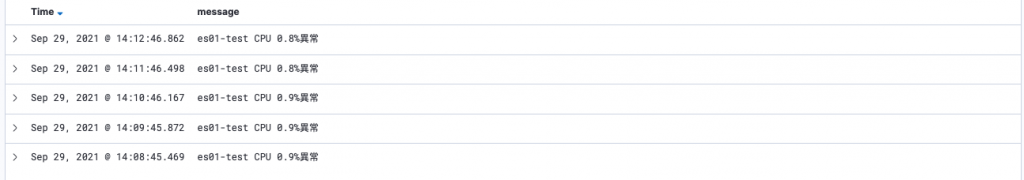
"message": "{{alertInstanceId}} CPU {{context.value.condition0}}异常",
"timestamp": "{{context.timestamp}}"
}
步骤五:存档後,警报器设定完成。
查看警报内容
我们来看一下it13-alert警报器触发後产生的索引it13-cpu资料内容。
Reference
>>: [13th][Day23] visualization
【没钱买ps,PyQt自己写】Day 8 – 我们的第二个 input 手段 – QLineEdit
看完这篇文章你会得到的成果图 前言 我们接下来的讨论,会基於读者已经先读过我 day5 文章 的架构...
async/await 连体婴
前言 非同步概念的最後一小块拼图,要来学习怎麽使用 async/await async/await ...
Day 30 (Jq)
** 请把这个写在最外层 让网页准备好! $(document).ready(function(){...
Day 10-自动化是工作标准化与效率的体现,Github Action 做 Terraform 自动化
本篇介绍 Terraform 透过 Github Action 自动化执行 课程内容与代码会放在 G...
[Vue2] 从初学到放弃 Day7-怎麽变化里面的值
先用官网里面的范例 <div id="example"> <p...