课堂笔记 - 深度学习 Deep Learning (6) Lab2
- 使用读档方式用python实作PLA
Lab2作业需求:
基本上和Lab大同小异,唯一要改的地方就是读取档案的部分:
from matplotlib import markers
import numpy as np
import matplotlib.pyplot as plt
# 分割资料
def getDataSet(filename):
dataSet = open(filename, 'r')
dataSet = dataSet.readlines()
num = len(dataSet)
x1 = np.zeros((num, 1))
x2 = np.zeros((num, 1))
y = np.zeros((num, 1))
for i in range(num):
data = dataSet[i].strip().split(",")
x1[i] = float(data[0])
x2[i] = float(data[1])
y[i] = float(data[2])
return num, x1, x2, y
def pla_with_data(num, x1, x2, y):
# 初始值 >> w=[0,0] b=0
w = np.zeros((2, 1))
b = 0
flag = 1
for k in range(100): # 限制无穷回圈 >> 次数设定100次
flag = 1
for i in range(num): # 看每个点是否为正确
dot = x1[i]*int(w[0])+x2[i]*int(w[1]) # 将一个点的座标带入 跟w作内积
if sign(dot, b) != y[i]: # 与参考资料y不相符 >> 线划分错误
flag = 0
w[0] += y[i] * x1[i] # 矫正 w = w + y*x
w[1] += y[i] * x2[i]
b = b + y[i] # 矫正 b = b + y
#print(w, b)
else:
continue # 与参考资料y相符 >> 下一个点
if flag == 1:
break # 全部的点都与参考资料y相符 >> 划分完成
return w, b
def sign(dot, b):
if dot+b >= 0:
return 1
else:
return -1
# 画图
def draw(x1, x2, y, prex1, prex2):
# 制作figure
fig = plt.figure()
# 图表的设定
ax = fig.add_subplot(1, 1, 1)
# 散布图
for i in range(num):
if y[i] == 1:
ax.scatter(x1[i], x2[i], color='red')
else:
ax.scatter(x1[i], x2[i], color='black')
for i in range(prenum):
ax.scatter(prex1[i], prex2[i], color='green', marker="x")
plt.show()
# 先读取训练资料
filename = r"Iris_training.txt"
num, x1, x2, y = getDataSet(filename)
# 把资料带入模型
w, b = pla_with_data(num, x1, x2, y)
# 再读取要预测的资料
filename = r"Iris_test.txt"
prenum, prex1, prex2, prey = getDataSet(filename)
# 输出预测结果
predict = 0
for i in range(prenum):
pre = np.sign((prex1[i]*w[0]+prex2[i]*w[1])+b)
if pre != prey[i]:
predict += 1
print('predict example %s = %s' % (i+1, pre))
print('error = %s / %s ' % (predict, prenum))
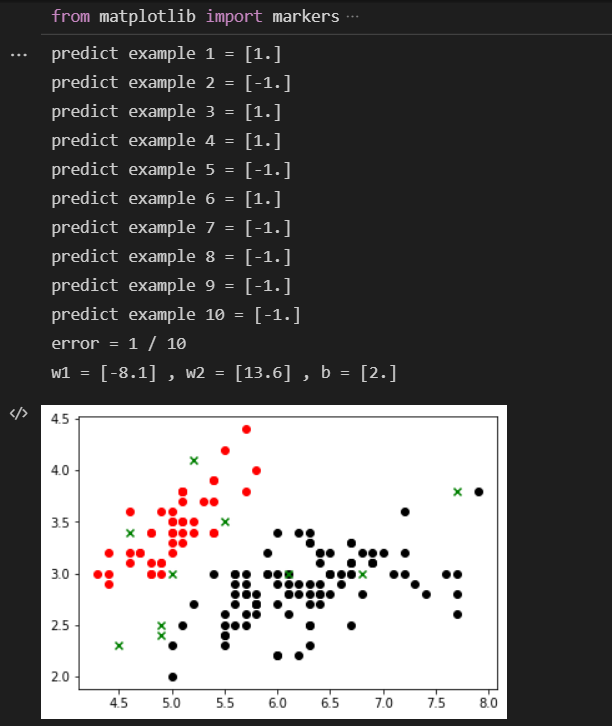
print('w1 = %s , w2 = %s , b = %s' % (w[0], w[1], b))
draw(x1, x2, y, prex1, prex2)
画图真的是弱项...另一半是因为偷懒 :)
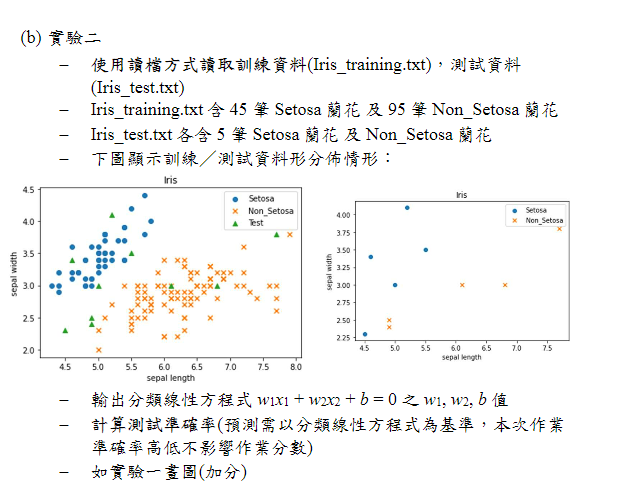
结果图:
github连结:
https://github.com/Minimindy/PLA-numpy-only-/tree/main
<<: 课堂笔记 - 深度学习 Deep Learning (5) Lab1
>>: 课堂笔记 - 深度学习 Deep Learning (7)
[Day 29]从零开始学习 JS 的连续-30 Days---网页座标及应用
网页座标及应用 首先怎麽读取与显示座标。 座标的判断依据。 如何动态撷取浏览器宽高。 mousemo...
当SFC在Windows上无反应时如何解决?
“在过去的几年中,我一直在使用系统档案检查器(SFC)扫描和修复损坏档案,但是昨天,当我尝试执行sf...
RESTful API
用户或资源所有者向身份提供者而不是联合系统中的资源或 API 服务器进行身份验证。身份提供者向客户端...
#23 数据中中的特徵相关性(2)
相关距离(Correlation Distance) 相关距离定义: python实现相关系数 im...
CMoney工程师战斗营weekly3
一山还有一山高课程难度有增无减的一周 上周老师说只要学完抽象类别後应该没有更难的东西,谁知道!!这周...