Elastic Stack第三十重
Logstash Part II
本篇介绍如何搭配filebeat和logstash,把apache log送至es
开始使用Logstash
[环境]
OS: Windows 10 (64bit)
上一重已经安装好Logstash而且建立一个basic pipeline
Parsing Logs with Logstash
在这篇章,会试着透过Filebeat取得Apache logs,然後输出至es
因此後续需要安装Filebeat及Logstash,如未安装Filebeat可参阅Elastic Stack第二十七重,如未安装Logstash可参阅Elastic Stack第二十九重
设定Filebeat,把Apache logs传送至Logstash
[Note]
因为同样会存取Apache log,所以如果有照Elastic Stack第二十七重做的话,要先刚把当时enabled的module apache 先disable,
以系统管理员打开 Windows PowerShell,至 Filebeat所在目录,执行以下指令
.\filebeat modules disable apache

如此一来,这样後续才不会有错误
至 Filebeat 目录下,打开 filebeat.yml 档案,修改地方如下
filebeat.inputs:
  enabled: true (1)
  paths:
    - D:\path\to\apache\log (2)
    #- /var/log/*.log (3)
(1): 设置为 true 此处设置的 paths 才会生效
(2): 设置自己local端的apache log location
(3): 原本预设是没有注解,这边不需要所以我注解此行
# ------------------------------ Logstash Output -------------------------------
output.logstash: (1)
  # The Logstash hosts
  hosts: ["localhost:5044"] (2)
(1)(2): 取消注解
#cloud.id: your_cloud_id
#cloud.auth: your_auth
注解此两行,不然稍後执行会有以下错误
Exiting: The cloud.id setting enables the Elasticsearch output, but you already have the logstash output enabled in the config
# ---------------------------- Elasticsearch Output ----------------------------
#output.elasticsearch: (1)
  # Array of hosts to connect to.
  #hosts: ["localhost:9200"] (2)
(1)(2): 注解此两行,不然稍後执行会有以下错误
Exiting: error unpacking config data: more than one namespace configured accessing 'output' (source:'filebeat.yml')
到此设定完成,试着开始执行看看 (至 Filebeat 目录)
.\filebeat -e -c filebeat.yml -d "publish"
会看到如下讯息是正常的,因为 Logstash 还没执行嘛~
INFO    [publisher_pipeline_output]     pipeline/output.go:143  Connecting to backoff(async(tcp://localhost:5044))
ERROR   [publisher_pipeline_output]     pipeline/output.go:154  Failed to connect to backoff(async(tcp://localhost:5044)): dial tcp [::1]:5044: connectex: No connection could be made because the target machine actively refused it.
设置Logstash的input来源是Filebeat
先展示一下Logstash的pipeline设定的skeleton(骨架)
# The # character at the beginning of a line indicates a comment. Use
# comments to describe your configuration.
input {
}
# The filter part of this file is commented out to indicate that it is
# optional.
# filter {
#
# }
output {
}
首先,把上面这段储存成档案 (e.g. first-pipeline.conf),放置在 Logstash目录 (e.g., D:/logstash-7.9.2/)
设定input来源来自 Filebeat,Logstash安装时,包含了 Beat input plugin,
此 plugin可以让 Logstash接收来自Elastic Beats 框架的事件,当然其中包含了 Filebeat
在 input 区块加入以下几行
beats {
    port => "5044"
}
因为要先测试看看是否正常,所以在 output 区块加入以下几行,把output设为stdout
stdout { codec => rubydebug }
上述添加完後, first-pipeline.conf 档案应该会长这样
input {
    beats {
        port => "5044"
    }
}
# The filter part of this file is commented out to indicate that it is
# optional.
# filter {
#
# }
output {
    stdout { codec => rubydebug }
}
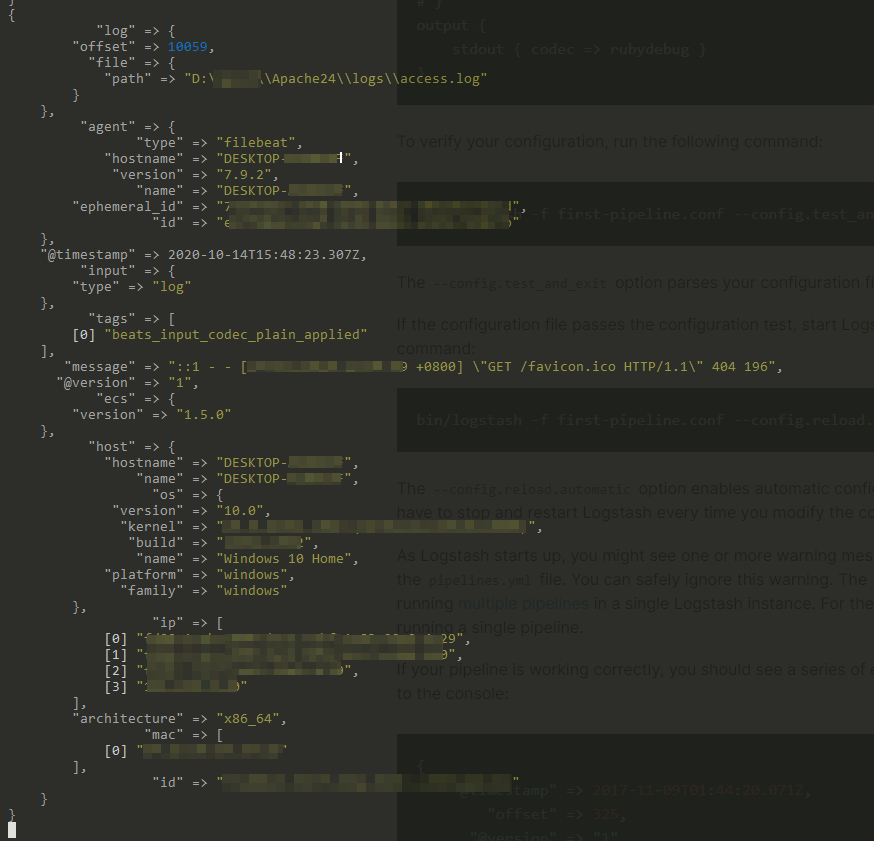
用以下指定来验证设定,可以在开一个cmd,然後至 Logstash 目录,
bin\logstash -f first-pipeline.conf --config.test_and_exit
其中 --config.test_and_exit 参数是用来parse设定,然後回报错误
设定档无误的话会有以下讯息
Using config.test_and_exit mode. Config Validation Result: OK. Exiting Logstash
设定正确的话,那就 启动Logstash吧~
bin\logstash -f first-pipeline.conf --config.reload.automatic
其中 --config.reload.automatic 参数设定可以让你在更新设定档後,会自动重新载入设定档,而不用每次修改後都去停止然後再启动
启动後,如果pipeline正确运行的话,会有类似以下的画面
设置Logstash的output为Elastic cloud的es
修改 first-pipeline.conf 档案至如下
input {
    beats {
        port => "5044"
    }
}
# The filter part of this file is commented out to indicate that it is
# optional.
# filter {
#
# }
output {
    elasticsearch {
		hosts => ["https://xxxxxxx.asia-east1.gcp.elastic-cloud.com:9243/"] (1)
		user => "elastic"
		password => "xxxxxxx" (2)
	}
}
(1)(2): 填入自己的elastic cloud
编辑完成储存後,等 Logstash 重载设定档完成後,然後到自己apache serve的网页浏览一下,
至Kibana确认是否有成功建立index及输入资料
GET _cat/indices?v
以我的为例,index name 为 logstash-2020.10.14-000001
查看资料
GET logstash-2020.10.14-000001/_search
成功了!!!
小小新手,如有理解错误或写错再请不吝提醒或纠正
先说声抱歉,中间原本是预计会说明filter,而且我在centos8成功过了,
但是Windows parse log一直有问题...
Reference
Logstash
Parsing Logs with Logstash
<<: 【Day 26】关於 Deno 与 NodeJS 的这些年和那些事
Backtrader - 自订 datafeeds
我们之前在喂历史资料,都是先用 shioaji 下载下来,然後再用 padas 转成 datafra...
[day19]Vue实作-登入功能实作串接後端API(上)调整bootstrapvue
框架用好了之後,就是一些功能的串接罗, 还记得之前使用json串接的画面吗?现在要从网站的登入画面进...
Day11 - 物理模拟篇 - 弹跳球世界II - 成为Canvas Ninja ~ 理解2D渲染的精髓
继上一篇我们讲到向量类的建立,接着我们在这一篇文机会提到反射行为的模拟~ 反射这种行为,在反射面为铅...
Day12 经常搞混的CSS Position
每次要用到绝对定位和相对定位时,我都会忘记他们分别代表的是什麽,又再google一次,这次决定好好把...
Day 14: 人工智慧在音乐领域的应用 (AI作曲-演算法基础概念)
接下来的几天我们会比较详细的介绍几个演算法是如何运用在作曲上,但在我们开始进入演算法作曲之前,我们要...