利用 Grafana Operator 部署 Grafana 到 OpenShift,并建立客制化的 Dashboard。
在前篇文章中,我已经将 Grafana Operator 部署到 "brandon" 的专案空间。这篇文章将介绍如何透过 Grafana Operator 部署另一个 Grafana 并为应用程序客制化自己的 Grafana Dashboard。
部署 Grafana Instance
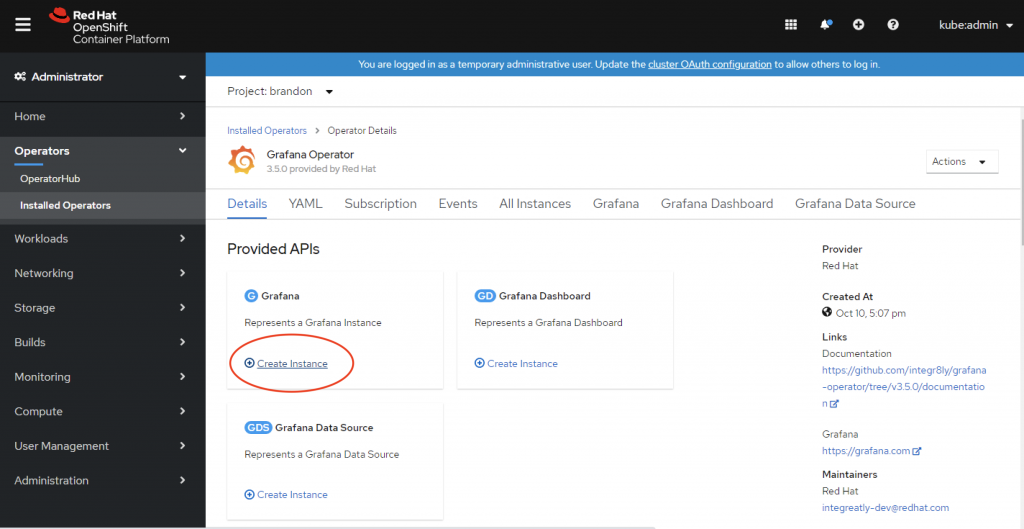
从 “Installed Operators” 页面, 选择 “Grafana Operator,然後再点选建立新的 Grafana instance 。
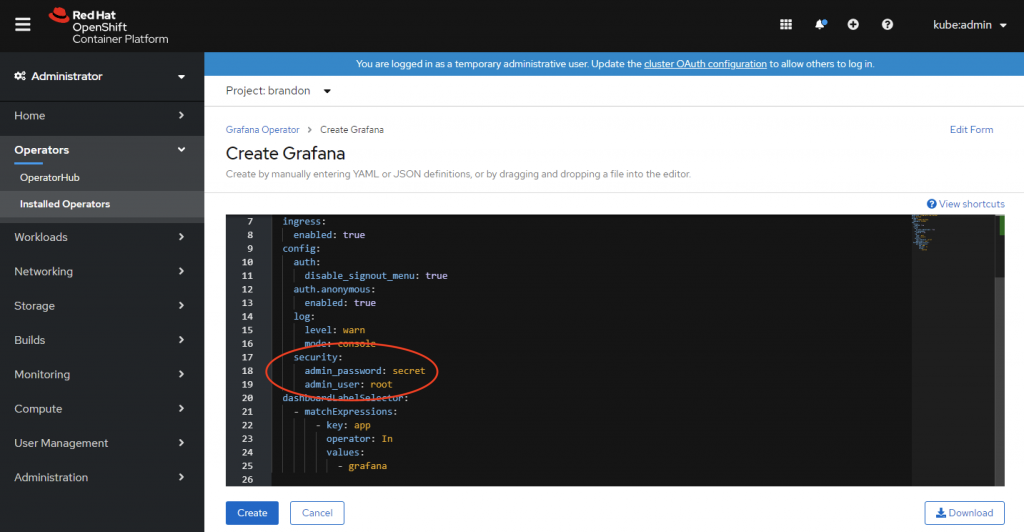
建立新的 Grafana instance 过程中,可以修改 YAML 档案中管理者的 username 跟 password 。然後按下 "Create"。
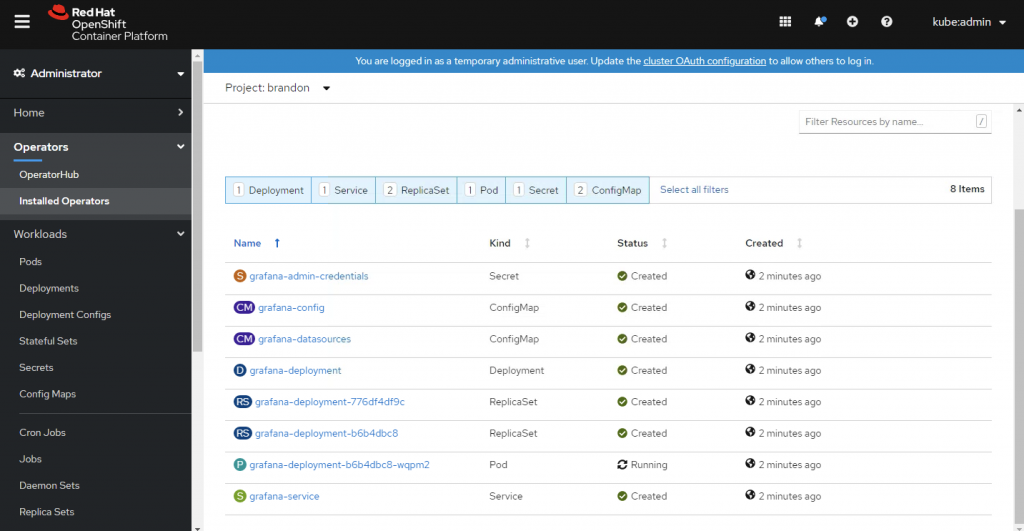
确定 Grafana Pod 的状态是 ”running“。
连接到内建的 Prometheus
在建立 Grafana instance 时, “grafana-serviceaccount” service account 也会被建立。 我们必须 assign "cluster-monitoring-view" role 给这个 service account,让它有权限读取 Prometheus 的资源。
$ oc project brandon
$ oc adm policy add-cluster-role-to-user cluster-monitoring-view -z grafana-serviceaccount
设定 Grafana Data Source
先取得 “grafana-serviceaccount” service account 的 bearer token。
$ oc serviceaccounts get-token grafana-serviceaccount -n brandon
在 Grafana Operator 的页面,点取建立新的 ”Grafana Data Source“,然後将下列 YAML贴上,并把 ${BEARER_TOKEN} 更改为刚刚取得的bearer token,然後按下 “Create“。
apiVersion: integreatly.org/v1alpha1
kind: GrafanaDataSource
metadata:
  name: prometheus-grafanadatasource
spec:
  datasources:
    - access: proxy
      editable: true
      isDefault: true
      jsonData:
        httpHeaderName1: 'Authorization'
        timeInterval: 5s
        tlsSkipVerify: true
      name: Prometheus
      secureJsonData:
        httpHeaderValue1: 'Bearer ${BEARER_TOKEN}'
      type: prometheus
      url: 'https://thanos-querier.openshift-monitoring.svc.cluster.local:9091'
  name: prometheus-grafanadatasource.yaml
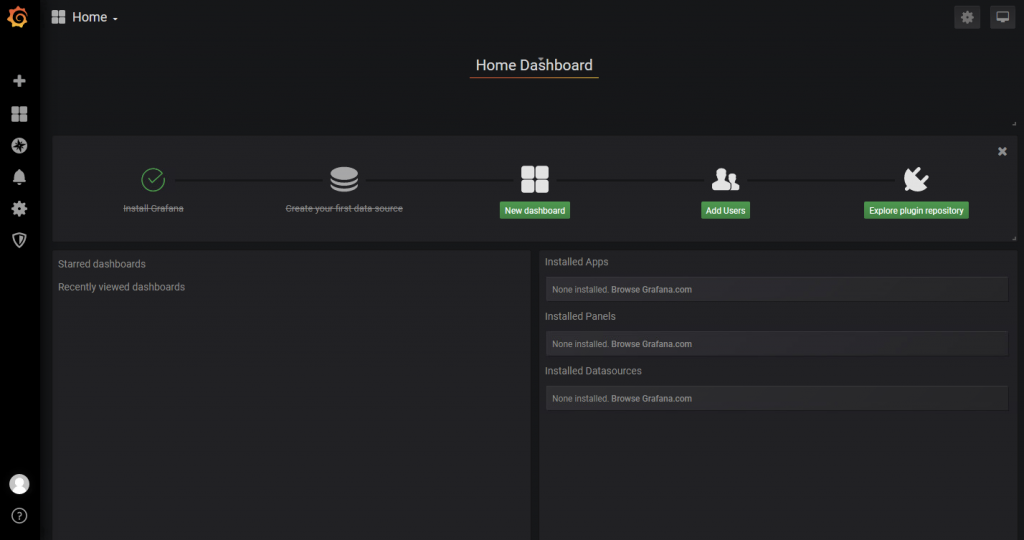
连接到 Grafana Web UI
从 Networking -> Routes 页面确认 Grafana URL,并利用之前设定的管理者帐号跟密码登入。
确定我们可以查询 prometheus 的 metrics。
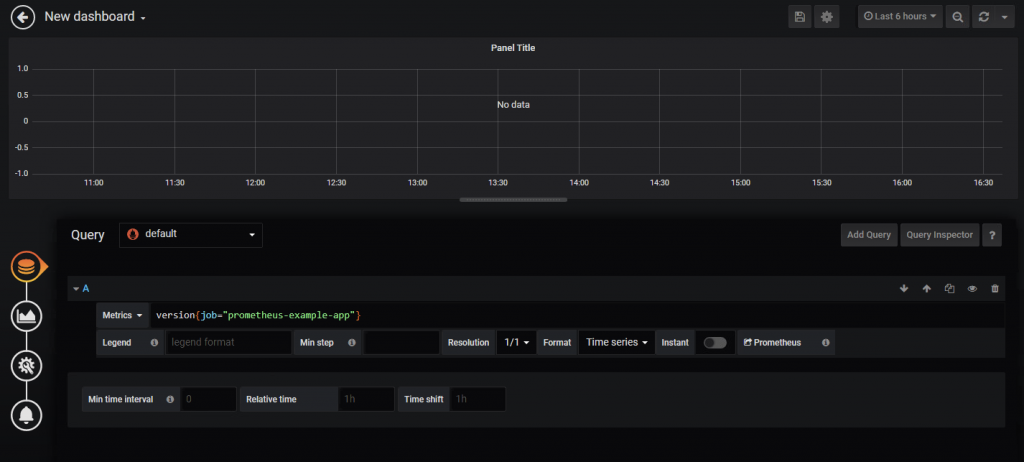
客制化 Grafana Dashboard
你可以手动从 Grafana 直接建立或建立新的 "GrafanaDashboard".
在 Grafana Operator 的页面,点取建立新 Grafana Dashboard,并将下列 YAML 档贴上,然後按下 “Create“。
apiVersion: integreatly.org/v1alpha1
kind: GrafanaDashboard
metadata:
labels:
app: grafana
name: simple-dashboard
namespace: brandon
spec:
json: |
{
"annotations": {
"list": [
{
"builtIn": 1,
"datasource": "-- Grafana --",
"enable": true,
"hide": true,
"iconColor": "rgba(0, 211, 255, 1)",
"name": "Annotations & Alerts",
"type": "dashboard"
}
]
},
"editable": true,
"gnetId": null,
"graphTooltip": 0,
"id": 6,
"links": [],
"panels": [
{
"cacheTimeout": null,
"colorBackground": false,
"colorValue": false,
"colors": [
"#299c46",
"rgba(237, 129, 40, 0.89)",
"#d44a3a"
],
"datasource": null,
"format": "none",
"gauge": {
"maxValue": 100,
"minValue": 0,
"show": false,
"thresholdLabels": false,
"thresholdMarkers": true
},
"gridPos": {
"h": 9,
"w": 12,
"x": 0,
"y": 0
},
"id": 2,
"interval": null,
"links": [],
"mappingType": 1,
"mappingTypes": [
{
"name": "value to text",
"value": 1
},
{
"name": "range to text",
"value": 2
}
],
"maxDataPoints": 100,
"nullPointMode": "connected",
"nullText": null,
"options": {},
"postfix": "",
"postfixFontSize": "50%",
"prefix": "",
"prefixFontSize": "50%",
"rangeMaps": [
{
"from": "null",
"text": "N/A",
"to": "null"
}
],
"sparkline": {
"fillColor": "rgba(31, 118, 189, 0.18)",
"full": false,
"lineColor": "rgb(31, 120, 193)",
"show": false,
"ymax": null,
"ymin": null
},
"tableColumn": "",
"targets": [
{
"expr": "version{job=\"prometheus-example-app\"}",
"refId": "A"
}
],
"thresholds": "",
"timeFrom": null,
"timeShift": null,
"title": "App Version",
"type": "singlestat",
"valueFontSize": "80%",
"valueMaps": [
{
"op": "=",
"text": "N/A",
"value": "null"
}
],
"valueName": "avg"
}
],
"schemaVersion": 21,
"style": "dark",
"tags": [],
"templating": {
"list": []
},
"time": {
"from": "now-6h",
"to": "now"
},
"timepicker": {},
"timezone": "",
"title": "Example App Dashboard",
"uid": "DAs6rtcGz",
"version": 1
}
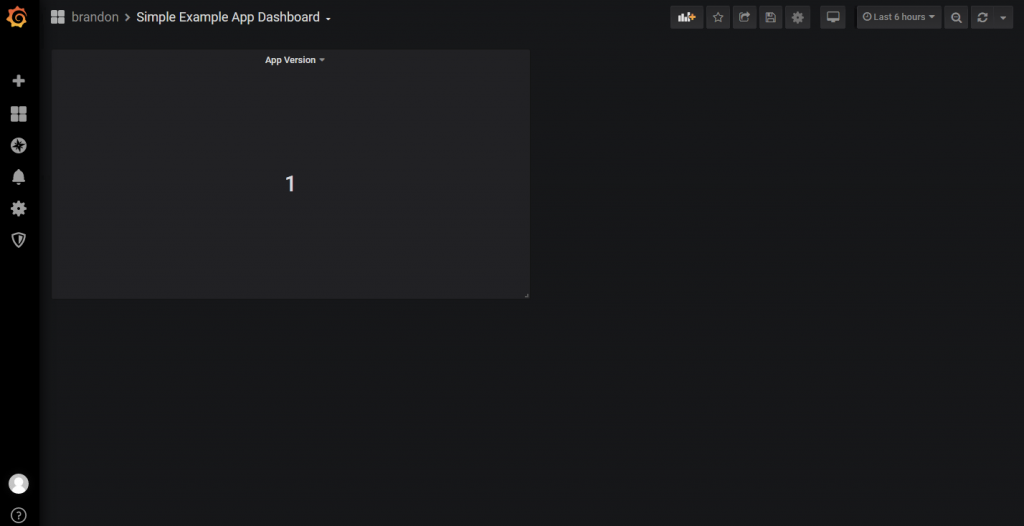
name: simple-dashboard.json
回到 Grafana Web UI,确定新的 Dashboard 有被建立。
Reference
https://www.redhat.com/en/blog/custom-grafana-dashboards-red-hat-openshift-container-platform-4
>>: op.26 《全领域》-全域开发实战 - 居家植物盆栽 Mvt I (NodeMCU & MQTT)
软件开发 五层次的用户体验
软件开发中,产品经理在规划产品方案时,都会注意用户体验的部分,其实关於用户体验的部分 James G...
[Day 17] 阿嬷都看得懂的程序码编辑器与开源软件是什麽
阿嬷都看得懂的程序码编辑器与开源软件是什麽 我们终於写出了第一支 .html 与 .css 档案了,...
六边形架构图
六边形架构图 (Hexagonal Architecture Diagram) 是一种用於软件设计的...
如何在 Angular 取得当前页面的绝对路径
情境 当有一个连结需要另开新页时,在 develop 或 production 需要对应到正确的路径...
防止自动锁屏
缘由: UIUX提出说想让App使用者的手机可以一直亮着,不会自动锁屏,虽然心里知道是有可能的,但没...