Day27-D3 进阶图表:甜甜圈图
本篇大纲:范例一、范例二
昨天我们讲完了基础图表的章节,学会圆饼图、散点图、直条图跟折线图等等基础常见的图表,今天我们要进到进阶的图表啦!进阶的图表主要是较少用到或是写法较困难的图表,有些进阶图表是从基础图表演化而来,例如:甜甜圈图、气泡图等;有些则是由完全不同的方法撰写而成的图表,例如阶层图、地图等等。我们就先从延伸而来的图表开始讲起吧!今天~就让我们来看看从圆饼图延伸而来的甜甜圈图!
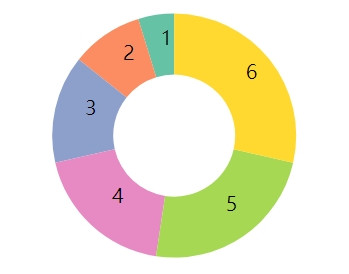
我们今天的范例有两个,第一个是基础的甜甜圈图:

第二个是加上标示线段的甜甜圈图
甜甜圈图的关键
甜甜圈图其实是从圆饼图延伸而来,它的关键就在於设定圆饼内圈的半径。使用 d3.arc 设定圆弧的形状时,可以分别设定内弧跟外弧的半径
- arc.innerRadius ⇒ 内弧
- arc.outerRadius ⇒ 外弧
// Creating arc
const arc = d3.arc()
				.innerRadius(50)
				.outerRadius(100);
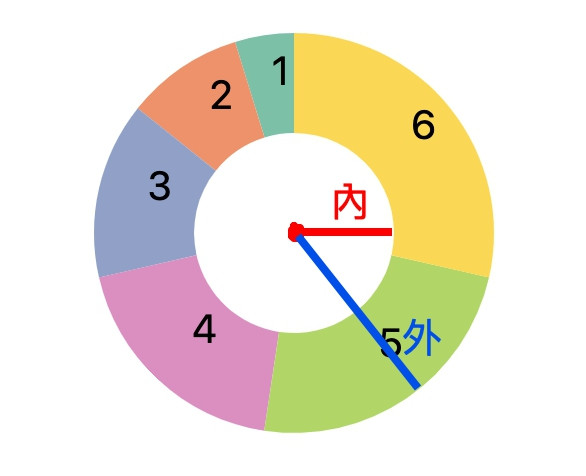
如果把内弧半径设为0的话,就会形成圆饼图;但如果内弧半径设定成不同数值,就能任意调整内圈半径,进而形成甜甜圈图。现在我们就来看看范例一要怎麽做吧!
范例一
我们先来画一个基本的甜甜圈图加上资讯。首先,一样先取资料并建立svg
// html
<div class="basicDonut"></div>

// js
const data = [
    { "value": 1, "property": "p1" },
    { "value": 2, "property": "p2" },
    { "value": 3, "property": "p3" },
    { "value": 4, "property": "p4" },
    { "value": 5, "property": "p5" },
    { "value": 6, "property": "p6" }
]

// 建立svg
const svg = d3.select(".basicDonut")
            .append('svg')
            .attr('width', 300)
            .attr('height', 300);
再来,我们用 d3.pie( ) 方法来建立生成圆饼图的方法,然後用 d3.arc( ) 绘制弧度
// 用 pie()建立圆饼图 generator
const pie = d3.pie()
    .value((d) => { return d.value })
    (data);

// 建立圆弧
const arc = d3.arc()
    .innerRadius(50)
    .outerRadius(100);
接着就是简单的绑定资料并加上路径啦
// 绑定资料
const arcs = svg.append("g")
    .attr("transform", "translate(150, 120)")
    .selectAll("arc")
    .data(pie)
    .enter()
    .append("g");

// 加上路径
arcs.append("path")
    .attr("fill", (data, i) => {
        return d3.schemeSet2[i];
    })
    .attr("d", arc);
如果想要加上资料标示,就一样用 append.text的 方式去处理
// 加上内部文字标示
arcs.append("text")
    .attr("transform", (d) => {
        return "translate(" +
            arc.centroid(d) + ")";
    })
    .text(function (d) {
        return d.value;
    });
这样就完成啦~写起来是不是几乎跟圆饼图一模一样呢?
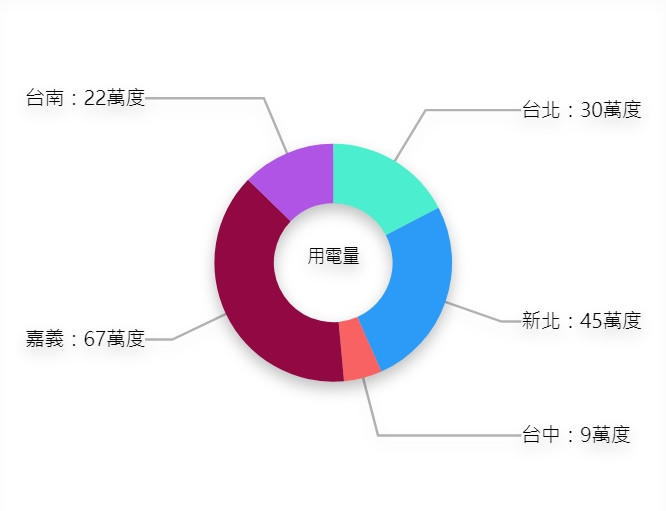
范例二
我们接着再来看看范例二,这个就比较有趣~是加上外拉的标签线段来标示每个区块的资料,并在内圈放上图表的主题

首先,我们一样先把甜甜圈图建立出来
// html
<div class="advancedDonut"></div>

// js
// 建立资料
const data = [{city:'台北', data:30},{city:'新北', data:45},
        {city:'台中', data:9},{city:'嘉义', data:67},{city:'台南', data:22}]

// RWD 的svg 宽高
const svgWidth = parseInt(d3.select('.basicDonut').style('width')),
      svgHeight = svgWidth*0.8,
      margin = 60

var svg = d3.select(".advancedDonut").append("svg")
  .attr("width", svgWidth)
  .attr("height", svgHeight)
  .append("g");

// 设定图表宽高与圆弧半径
const width = svgWidth-margin*2;
const height = svgHeight-margin*2;
// radius设定圆饼图的圆弧大小,是区域的一半
const radius = Math.min(width, height)/2;

// 设定颜色
const color = d3.scaleOrdinal()
                .range(["#4BEFCF","#2c9af7","#F96262", '#910842', '#b054e5']);

// 圆饼、线段、标签
svg.append("g")
    .attr("class", "slices");

svg.append("g")
  .attr("class", "labels");

svg.append("g")
  .attr("class", "lines");

// 建立圆饼图
const pie = d3.pie().sort(null).value(d => d.data);
const arc = d3.arc().innerRadius(radius*0.3).outerRadius(radius*0.6);

// 设定弧度
const outerArc = d3.arc()
            .outerRadius(radius * 0.9)
            .innerRadius(radius * 0.9);

// 建立甜甜圈图
svg.attr("transform", "translate(" + svgWidth / 2 + "," + svgHeight / 2 + ")");

svg.selectAll('path')
    .data(pie(data))
    .enter()
    .append('path')
    .attr('d', arc)
    .attr('fill', (d,i)=> color(i));
再来建立标示的线段跟文字标签。这边的关键是线段跟标签的位置,我们要根据外弧的位置去设定,因此会用outerArc.centroid 去处理
// 建立线段跟标示
svg.append('g').classed('labels',true);
svg.append('g').classed('lines',true);


// 设定线段
const polyline = svg.select('.lines')
            .selectAll('polyline')
            .data(pie(data))
            .enter()
            .append('polyline')
            // 这边是关键,要根据外弧的位置去调整线段位置
            .attr('points', function(d) {
                const pos = outerArc.centroid(d);
                pos[0] = radius * 0.95 * (midAngle(d) < Math.PI ? 1 : -1);
                return [arc.centroid(d), outerArc.centroid(d), pos]
            });

// 设定文字标签
const label = svg.select('.labels').selectAll('text')
            .data(pie(data))
            .enter()
            .append('text')
            .attr('dy', '.35em')
            .html(d => `${d.data.city}:${d.data.data}万度`)
            // 这边是关键,要根据外弧的位置去调整标签位置
            .attr('transform', function(d) {
                const pos = outerArc.centroid(d);
                pos[0] = radius * 0.95 * (midAngle(d) < Math.PI ? 1 : -1);
                return 'translate(' + pos + ')';
            })
            .style('text-anchor', function(d) {
                return (midAngle(d)) < Math.PI ? 'start' : 'end';
            });

// 绑定文字标签要显示的内容
svg.append('text')
    .attr('class', 'toolCircle')
    .attr('dy', 0)
    .html('用电量')
    .style('font-size', '.9em')
    .style('text-anchor', 'middle');

function midAngle(d) { return d.startAngle + (d.endAngle - d.startAngle) / 2; }
然後我们可以将线段跟文字标签设定一些样式
/*资料轴线*/
.advancedDonut polyline {
    opacity: .3;
    stroke: black;
    stroke-width: 2px;
    fill: none;
}

/* 字体加粗*/
.labelName tspan {
    font-style: normal;
    font-weight: 700;
}

/* 字形 */
.labelName {
    font-size: 0.9em;
    font-style: italic;
}
这样就完成啦!是不是也没多困难呢?今天的甜甜圈图就讲到这边~明天要来讲气泡图罗!
Github Page 图表与 Github 程序码
最後附上本章的程序码:想看完整程序码的请上 Github,想直接操作图表的则去 Github Page 吧!请自行取用~
<<: 【後转前要多久】# Day24 JS - JavaScript 物件、函式
>>: [Day 24] SQL union / union all
[Day 22] 验证资料 — 不可以色色! 加装资料界的色情守门员
I used to be an adventurer like you, then I took ...
Day 30 KubeEdge的使用心得与总结
KubeEdge 使用心得 KubeEdge的使用导向应是以"云边协同"、&qu...
【Day 12】使用 Systems Manager 的 Parameter Store 保存变数
tags: 铁人赛 CodeBuild AWS SSM 前言 关於 Developer Tool -...
DAY14:玉山人工智慧挑战赛-中文手写字辨识(OpenCV图像处理)
问题及解决方法 用YOLOv4模型裁切出来的文字,大部分的图档,都有红框等杂讯的存在,如下图。若将含...
[Day21]- 正则表达式
基础 用文字去表达,使用\d去表示0-9的数字字元,使用re模组内有的compile()方法,回传...