DAY 26 制作表格-生成表格
上篇加入了支持中文的字体,这边使用matplotlib.pyplot与资料库资料生成表格
生成表格
cursor = conn.cursor()
cursor.execute(f"SELECT keyword,name,quantity FROM group_buying_user NATURAL JOIN group_buying_message order by keyword;")
users = cursor.fetchall()
cursor.close()
import matplotlib.pyplot as plt
#设置你的字体
plt.rcParams['font.sans-serif'] = ['Arial Unicode MS']
#为fig与ax新增一个[1,1]的子图
fig, ax =plt.subplots(1,1)
data=[]
#column文字标签
column_labels=['keyword','name','quantity']
#将资料添加至data
for user in users:
    data.append([user[0],user[1],user[2]])
#关闭座标轴线
ax.axis('off')
ax.table(cellText=data,colLabels=column_labels,loc="center")
#储存图片
plt.savefig('table.png',dpi=200)
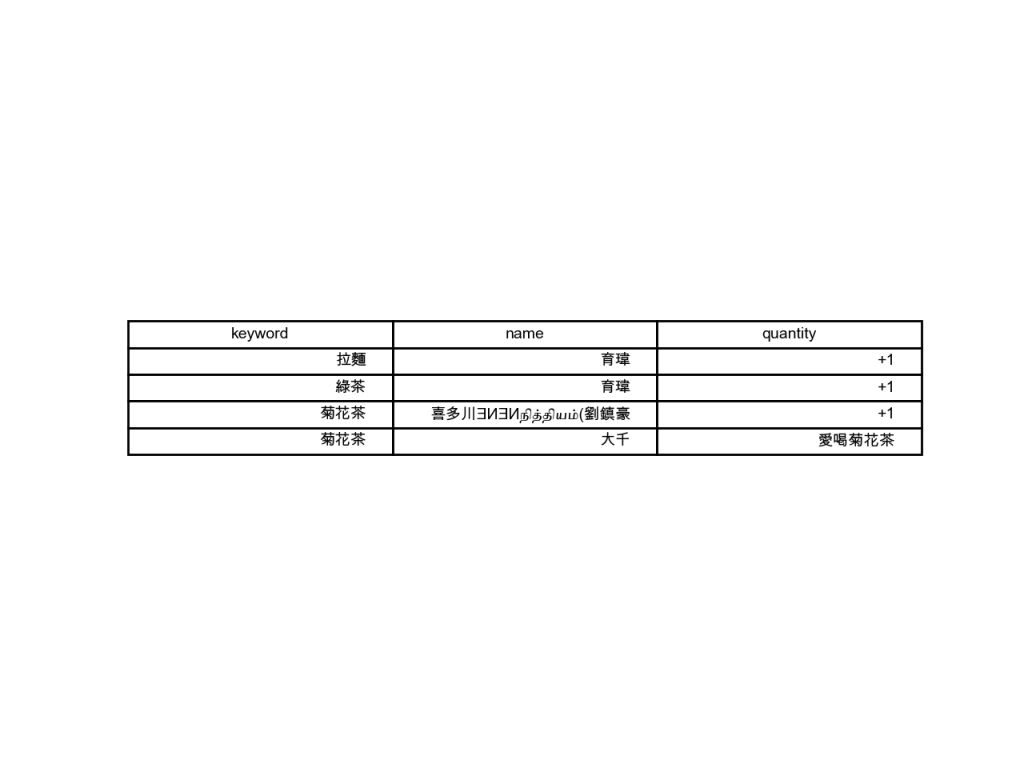
生成的表格图片
>>: DAY23-EXCEL统计分析:双因子变异数分析实例
Day18 用CSS做出动画效果
还没学到这个属性之前,一直以为必须使用到JavaScript,才能让网页有动画的效果,没想到用CS...
爬虫怎麽爬 从零开始的爬虫自学 DAY9 python字串怎麽用
前言 各位早安,书接上回我们练习了python变数的一些基本应用,今天我们要练习python字串的使...
Day_02 系统安装(一)
玩OpenWrt第一步当然是制作系统,下载系统映像的入口其实很多,但这个路径我觉得最直观与便捷。可以...
[Part 4 ] Vue.js 的精随-元件 Slots
Slots ? 想要传入内容到子层中,slots 是另一种可以选择的方式,在 component 预...
[DAY22]安装Heroku Postgres插件
回到Heroku登入後点选resources 按下add-ons 找到Heroku postgres...