D3JsDay18 不让资料进坟墓,秒懂农产品分布—实际资料画地图
我们到政府开放资料平台下载这两个档案,第一个是包含各种伴手礼的经纬度资料、名称、介绍等等作为要画在地图上的资料,另一个是台湾地图的shp档案,作为绘制地图用。
排版
我们预计将svg和一个div的class叫做wrap-item放在wrap里面,然後撰写css使用flex来进行排版,svg这个容器是要放地图档案和农产品的经纬度预计要制作成circle的点状的样子来当作该地区有农产品的位置,wrap-item则是我们要显示这些农产品的名称、住址、电话、介绍等等的容器,程序码如下
<style>
.wrap{
    display: flex;
    width: 1440px;
    justify-content: center;
}
svg{
    border:solid 1px  black;
}
</style>
<body>
<div class="wrap">
</div>
let width = 800;
let height = 600;
const projection = d3.geoMercator()
                    .center([123, 24 ])
                    .scale(5000);
const svg = d3.select("body").select(".wrap").append("svg")
                .attr("width", width)
                .attr("height", height);
const path = d3.geoPath()
            .projection(projection);

const g = svg.append("g");
d3.select(".wrap").append("div").classed("wrap-item",true);//选择class是wrap的元素插入div并且命名为wrap-item
</body>
透过前几天的教学将shp档案转换至topojson档案後,接下来我们载入地图的资料
d3.json("taiwantopo.json").then(function(topology) {
    console.log(topology);
});
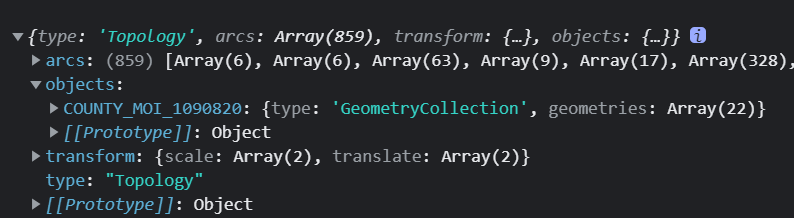
一样我们先观察转换後的topojson的哪一个部分是我们需要的东西。
如下图objects里面的COUNTY_MOI_1090820是我们需要的东东西
资料绑定画台湾
接下来我们就进行资料绑定的部分,绑定到path的内容是geojson的features
程序码如下
d3.json("taiwantopo.json").then(function(topology) {
    console.log(topology);
    const makeColor = d3.scaleSequential(t => d3.hsl(t * 360, .8, .9).formatRgb()).domain([0,30]);
    g.selectAll("path")
        .data(
            topojson
                .feature(topology, topology.objects.COUNTY_MOI_1090820)
                .features
                )
        .join("path")
        .style('fill', (d,i)=>{
            return makeColor(i);
        })
        .style("stroke", "gray")
        .style("stroke-width",".25")
        .style("stroke-opacity",".5")
        .attr("d", path);
});
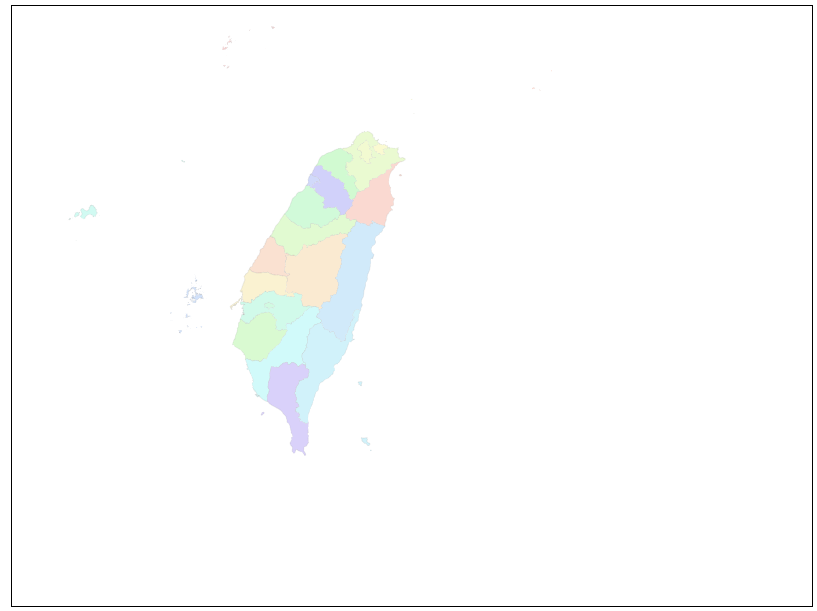
这次没有额外宣告一行,直接将topojson转geojson和取出里面的features绑定data到path里面,另外第3行制作颜色函数的程序码,由於台湾大概有二十几个县市,我们就设定domain([0,30]),这时候可以看到如下图
载入农产品地图
为了确保地图资料载入之後再载入农产品,我们可以接一个.then(function{})在刚刚画完台湾地图的地方
程序码大致如下
d3.json("taiwantopo.json")
.then(function(topology) {
// 以下省略
}
.then(function(){
  d3.json("farm-product-map.json").then(function(product){
    console.log(product);
  })
})
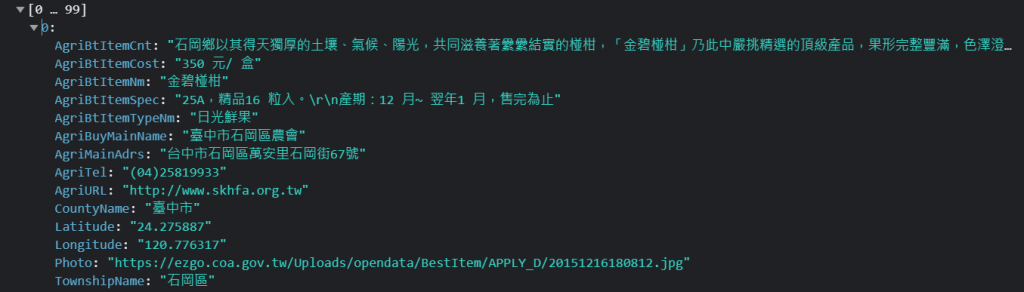
我们可以console.log()确认看资料是否有正确载入如下图
加入小圆点的位置
接下来我们可以进行资料绑定与先前的做法都一样是半径设为1然後设定淡绿色,此时要考虑的地方是圆的位置
d3.json("farm-product-map.json").then(function(product){
    console.log(product);
    g.selectAll("circle")
    .data(product)
    .join("circle")
    .attr("cx", function(d) {
          //?????
    })
    .attr("cy", function(d) {
          //?????
    })
    .attr("r", 1)
    .style("fill", "lightgreen")
 })
官方API说明如下
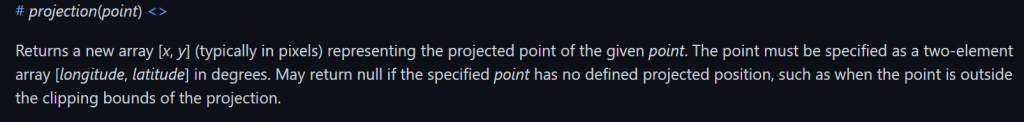
因此我们可以得知要带入的是[longitude, latitude],他将会正确地返回一个转换後的svg位置
,我们可以试着插入console.log(projection([d.Longitude,d.Latitude]));程序码在问号的位置印出讯息,之後看主控台如下
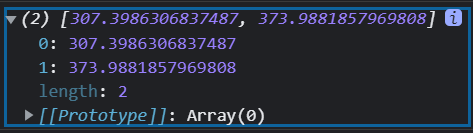
它印出x和y的位置所形成的阵列,因此我们阵列索引值0来当作cx的属性位置,1来当作cy的属性位置,最後程序码如下
g.selectAll("circle")
  .data(product)
  .join("circle")
  .attr("cx", function(d) {
          // console.log(d);
          // console.log(projection([d.Longitude,d.Latitude]));
          console.log(projection([d.Longitude,d.Latitude]));
          return projection([d.Longitude, d.Latitude])[0];
  })
  .attr("cy", function(d) {
          return projection([d.Longitude, d.Latitude])[1];
  })
  .attr("r", 1)
  .style("fill", "lightgreen")
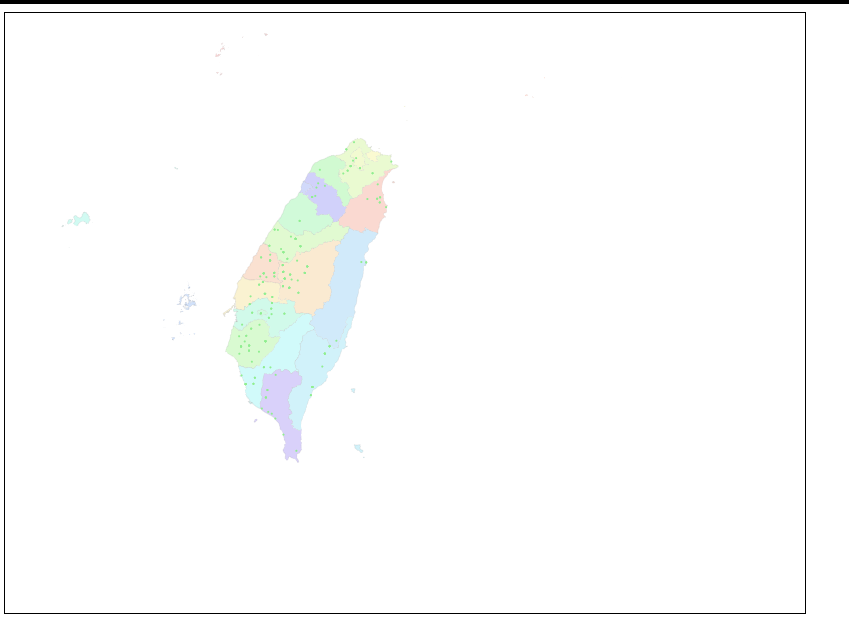
最後就可以印出各个农产品的位置在地图上了
如下图
本日完整程序码如下
<style>
.wrap{
    display: flex;
    justify-content: center;
}
svg{
    border:solid 1px  black;
}

</style>
<body>
    <div class="wrap">
    </div>
<script>
let width = 800;
let height = 600;
const projection = d3.geoMercator()
                    .center([123, 24 ])
                    .scale(5000);
const svg = d3.select("body").select(".wrap").append("svg")
                .attr("width", width)
                .attr("height", height);
const path = d3.geoPath()
            .projection(projection);
const g = svg.append("g");
d3.select(".wrap").append("div").classed("wrap-item",true);
d3.json("taiwantopo.json")
.then(function(topology) {
    console.log(topology);
    const makeColor = d3.scaleSequential(t => d3.hsl(t * 360, .8, .9).formatRgb()).domain([0,30]);
    g.selectAll("path")
        .data(
            topojson
                .feature(topology, topology.objects.COUNTY_MOI_1090820)
                .features
                )
        .join("path")
        .style('fill', (d,i)=>{
            return makeColor(i);
        })
        .style("stroke", "gray")
        .style("stroke-width",".25")
        .style("stroke-opacity",".5")
        .attr("d", path);
})
.then(function(){
    d3.json("farm-product-map.json").then(function(product){
        g.selectAll("circle")
        .data(product)
        .join("circle")
        .attr("cx", function(d) {
                // console.log(d);
                // console.log(projection([d.Longitude,d.Latitude]));
                console.log(projection([d.Longitude,d.Latitude]));
                return projection([d.Longitude, d.Latitude])[0];
        })
        .attr("cy", function(d) {
                return projection([d.Longitude, d.Latitude])[1];
        })
        .attr("r", 1)
        .style("fill", "lightgreen")
    })
});
</body>
小总结
今天先印出农产品位置图,明天再做互动性,来让使用者可以滑入点的时候观看农产品的内容
<<: TypeScript 能手养成之旅 Day 16 类别(Class)
>>: Day18-13. Roman to Integer
Day 25:从头开始的 Scroll Behavior
目前导览项目页面愈来愈完整,相对有愈来愈多小细节需要留意,尤其是资料量变多时,许多浏览时伴随的滚动效...
DAY25 深度学习-卷积神经网路-Yolo v3
今天介绍一下Yolo v3, 首先在v3中使用了darknet-53的架构,架构如下图: 相比v2的...
DAY2 安装 Docker
DAY 2 今天要来安装kubernetes,不过在安装k8s前我们需要先装docker,有关doc...
Day 12 (Ai)
2021版本才能存云端文件 => 可以版本控制 =>视窗 =>版本纪录 1.基础...
Day 20 - 重新检视 mAP, F1, IoU, Precision-Recall 精准度
Day 20 - 重新检视 mAP, F1, IoU, Precision-Recall 精准度 A...