从细针切片资料集 建模、预测肿瘤Sklearn Breast Tumor Prediction
本文重点:细针活体切片、乳房肿瘤、Sklearn模型、预测
完整代码+csv+model 在GitHub
(一)、认识资料集:
Breast cancer Datasets有多个版本,我们先来认识一下资料集内容是什麽。
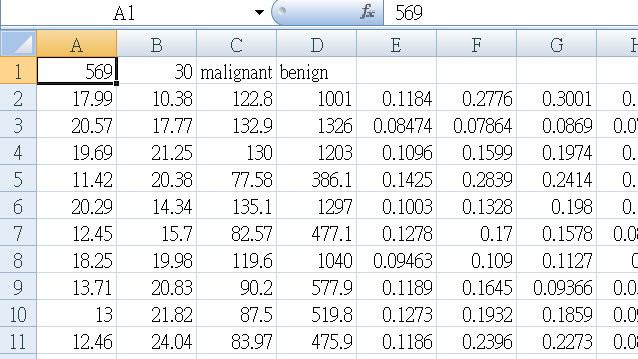
安装完Sklearn后,随附的Breast cancer.csv 有569笔资料,30个特徵栏位,1个诊断结果
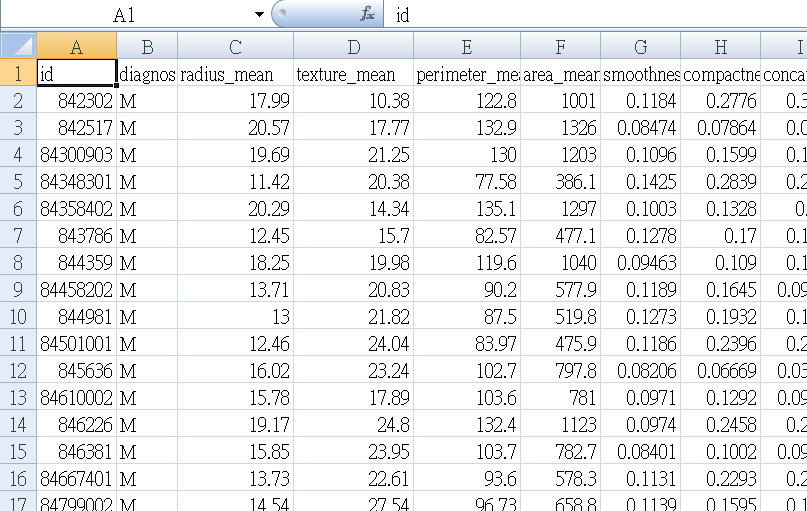
今天我们取用的是另外一个版本,Kaggle dataset,这是已经标上栏位名称的CSV档,特徵资料内容看起来和上一个档是一样的,也是569笔。
第一栏位增加了”id”,第二栏是target ”诊断”是文字(M 代表恶性 Malignant ,B代表良性Benign) ,其余30个栏位是”特徵数据”。
“特徵”所代表的意义:UCI machine learning center 有解说 link here
这些资料是从乳房肿瘤细针穿刺(Fine needle aspiration)样本取得的,特徵栏位所记录的是细胞核的多项数据资料:radius、texture、perimeter、area…等等。 资料集是这样子的
Kaggle讨论区有人提到说,Cancer其实就是”恶性”的专有名称,并不包含”良性”,不应该把资料集名称叫xxCancer,因此,我们也从善如流,将资料集改名为 BStumorKaggle.csv
Tumor肿瘤(或肿块)包含了”良性”与”恶性”。
(二)、本文目的: 训练-->建立模型-->预测
我们今天的重点在於建模、预测,而在Sklearn、Kaggle有多个范例是使用Seaborne画出华丽的图(violin、box、heatmap、swarm…),这些画图的部份,我们就略过不提了,以免失焦、馍糊了重点。
有兴趣者请参考此连结
(三)、建立模型
Step 1.以dataframe 读取csv 上一篇 以ndarray读取CSV的方式
Step 2.资料前处理
Step 3.Split data
Step 4.Build the Model
Step 5.评估模型准确度
Step 6.储存模型
以下直接贴代码,各段说明在代码内
# BStumor_detect.py  2021/9/5 neoCaffe
import numpy as np
import pandas as pd
from sklearn.preprocessing import StandardScaler
from sklearn.model_selection import train_test_split

''' Step 1. 以dataframe 读取csv '''
print('以dataframe 读取 csv')
df = pd.read_csv('BStumorKaggle.csv')
print(f'df.shape : {df.shape}')
print(f'栏位: {df.columns}')
print(f'前5笔记录: {df.head()}')
# 节省篇幅,也因为栏位内容都没有缺损,所以这里没有写nan之处理

''' Step 2. 资料前处理 '''
# 设定 X ,y
y = df['diagnosis']    # y 诊断结果=diagnosis 栏位
''' 去除 id diagnosis 两个分类栏位,剩下特徵栏位-->X '''
df2 = df.drop(['id', 'diagnosis'], axis = 1)
print(df2.shape)
X = df2
print(X.head())   # X is a dataframe
print(y[:5])      # y is a Series

''' Step 3. Split data 分成 training 、testing 两组 '''
from sklearn.model_selection import train_test_split

X_train, X_test, y_train, y_test = train_test_split(X, y, test_size = 0.2, random_state = 42)

''' Step 4. Build the Model : training'''
# model logistic regression
from sklearn.linear_model import LogisticRegression
logis = LogisticRegression(solver='lbfgs',max_iter=400)
logis.fit(X_train, y_train)

# model random forest
from sklearn.ensemble import RandomForestClassifier
fores = RandomForestClassifier()
fores.fit(X_train, y_train)

''' 测试 抓一笔资料,试试看。此笔资料的 diagnosis 是 M '''
newX =[[13.73,22.61,93.6,578.3,0.1131,0.2293,0.2128,0.08025,
        0.2069,0.07682,0.2121,1.169,2.061,19.21,0.006429,0.05936,
        0.05501,0.01628,0.01961,0.008093,15.03,32.01,108.8,697.7,
        0.1651,0.7725,0.6943,0.2208,0.3596,0.1431]]

newP_logis = logis.predict(newX)  # 预测值
newP_fores = fores.predict(newX)
print(f'真正的诊断: M   LogisticRegression 预测诊断: {newP_logis}')
print(f'真正的诊断: M   RandomForest 预测诊断: {newP_fores}')

''' Step 5. 评估模型准确度  两种model的accuracy '''
from sklearn.metrics import accuracy_score
pred_logis = logis.predict(X_test)
pred_fores = fores.predict(X_test)

a1 = accuracy_score(pred_logis, y_test)
a2 = accuracy_score(pred_fores, y_test)
print(f'两种模型的准确率 accuracy: logis: {a1}  fores: {a2}')

''' Step 6. 储存模型  '''
import pickle

mdl_BSlr = 'BSlr.model'
pickle.dump(logis, open(mdl_BSlr, 'wb'))
mdl_BSfs = 'BSfs.model'
pickle.dump(fores, open(mdl_BSfs, 'wb'))
print('models saved ')
# --- 建模完成 ---
(四)、使用模型做预测
上面程序,将两个模型存档成 BSlr.model BSfs.model
另写个py 使用这两个模型 代码如下
test1 test2 是从csv档摘出来的两笔特徵资料,当测试。
''' 以两种模型进行预测 predict with loaded model '''
mdl_logis = pickle.load(open('BSlr.model', 'rb'))
predict1 = mdl_logis.predict(test1)

mdl_fores = pickle.load(open('BSfs.model', 'rb'))
predict2 = mdl_fores.predict(test2)

print(f'test1 真正诊断是: B  以logis模型预测是: {predict1}')
print(f'test2 真正诊断是: M  以fores模型预测是: {predict2}')
<<: day5 : rancher管理与简易的安装相关套件
>>: Day 5. Hashicorp Nomad: How to configure one service advertise multiple ports
新新新手阅读 Angular 文件 - Day05
学习内容 这篇内容是纪录阅读官方文件 Create a feature component 的内容。...
Day 9: Kotlin DSL 管理杂乱依赖的好帮手
Keyword: Kotlin DSL 到Day9使用Kotlin DSL 管理依赖的Code放在 ...
IOS、Python自学心得30天 Day-21 CoreML范例
前言: 关於前面mlmodel的部分还没搞定 事先测试了一下CoreML的功能 VC程序码: imp...
小知识 - Google Sheets 与 Excel 世仇之战
「鲑鱼均,因为一场鲑鱼之乱被主管称为鲑鱼世代,广义来说以年龄和脸蛋分类的话这应该算是一种 KNN 的...
[Day23]What's Cryptanalysis?
上一篇介绍了The 3n + 1 problem,这题给我们两个数字,并对范围内的每个数字N执行以下...