汇集 OpenShift logs 及 Metrics 到 Splunk 做监控.
之前的文章介绍了如何在 OpenShift 透过 Prometheus,AlertManager 跟 Grafana 来收集和监控服务的 Metrics,而对於 Logs 管理,OpenShift 官方是整合了 EFK (Elasticsearch + Fluentd + Kibana) 来做处理。
然後因为有些公司在导入 OpenShift 或 kubernetes 之前已经在使用 Splunk 企业版在做这件事,所以在这篇文章我将介绍如何透过 Splunk-connect-for-kubernetes 来将 OpenShift 的 logs 及 部分 Metrics 导入 Splunk 做监控及管理。
Splunk-connect-for-kubernetes 包含 3 个 Helm Charts:
| Component | Usage |
|---|---|
| logging | 收集 logs。 |
| metric | 收集 metrics, 譬如 cpu/memory usage。 |
| objects | 透过 Kubernetes API,收集系统物件的目前的状态,例如 events, Pod的资讯等 |
安装事前准备
- 允许 OpenShift 所有节点都可以连接到 Splunk HEC 端口: 8088
- Helm 3
- 如果 OpenShift 是部署在有网路限制的环境,必须先把需要的映像档下载到本地端映象仓库,例如 Quay。
- splunk-connect-for-k8s 最新版本。
Splunk 设定
-
建立新的 Splunk App: “ocp”
-
在新的 app 建立 以下 Indexes 给之後的 Http Event Collector (HEC) 做为预设的 Indexes
| index name | type | app |
|---|---|---|
| ocp_logging | Events | ocp |
| ocp_metrics | Metrics | ocp |
| ocp_objects | Events | ocp |
并把这些 Indexes push 到所有的 Splunk Indexer 节点。
- 建立 HTTP Event Collector (HEC) Token
打开 Settings > Data Inputs > HTTP Event Collector 页面
我们需要建立 3 个 HEC token 分别给 logging, metrics 跟 object 使用
| HEC Token name | App Context | Select Allowed Indexes | Default index |
|---|---|---|---|
| ocp-logging | ocp | ocp_logging | ocp_logging |
| ocp-metrics | ocp | ocp_metrics | ocp_metrics |
| ocp-objects | ocp | ocp_objects | ocp_objects |
注意: 建立 Token 过程中.不要启用 “indexer acknowledgement”。
部署 splunk-kubernetes-logging helm chart
- 客制化 values 值
最基本的 value 值范例:
splunk:
  hec:
    host: < splunk_host >
    port: 8088
    token: < splunk_hec_logging_token >
    indexName: < splunk_logging_indexname >
Optional: 客制化 buffer 设定
buffer:
  '@type': memory
  total_limit_size: 600m
  chunk_limit_size: 200m
  chunk_limit_records: 100000
  flush_at_shutdown: true
  flush_interval: 3s
  flush_thread_count: 4
  flush_thread_interval: 0.1
  flush_thread_burst_interval: 0.1
  overflow_action: drop_oldest_chunk
  retry_forever: true
  retry_wait: 60
Optional: 客制化 filter 设定
customFilters:
  SetIndexFilter:
    tag: "**"
    type: grep
    body: |
        <exclude>
                  key sourcetype
                  pattern /(fluentd:monitor-agent)/
                </exclude>
- 透过 helm 部署到 OpenShift Cluster
$ oc project splunk-connect
$ helm install -f logging_values.yaml splunk-logging https://github.com/splunk/splunk-connect-for-kubernetes/releases/download/1.4.3/splunk-kubernetes-logging-1.4.3.tgz
- 在 Splunk 搜寻 index="ocp_logging" 看是否有值。
index="k8s_logging"
部署 splunk-kubernetes-metrics helm chart
- 客制化 values 值
最基本的 value 值范例:
splunk:
  hec:
    host: < splunk_host >
    port: 8088
    token: < splunk_hec_metrics_token >
    indexName: < splunk_metrics_indexname >
Optional: 客制化 filter 设定
你可以参考 metrics-information 看支援的 metrics 有哪些,然後设定只将想监控的 metrics 传到 Splunk,以避免不必要的流量。 譬如:
customFilters:
  SetContainerFilter:
    tag: kube.container.**
    type: grep
    body: |
        <regexp>
                key metric_name
                pattern /(cpu.usage_rate|cpu.limit|memory.usage|memory.limit)/
              </regexp>
  SetPodFilter:
    tag: kube.pod.**
    type: grep
    body: |
        <regexp>
                key metric_name
                pattern /(network.rx_bytes|network.tx_bytes|network.rx_errors|network.tx_errors|cpu.load.average.10s|cpu.usage_rate|cpu.limit|memory.usage|memory.limit|memory.available_bytes|volume.available_bytes|volume.used_bytes)/
              </regexp>
  SetNamespaceFilter:
    tag: kube.namespace.**
    type: grep
    body: |
        <regexp>
                key metric_name
                pattern /(usage|limit)/
              </regexp>
  SetNodeFilter:
    tag: kube.node.**
    type: grep
    body: |
        <regexp>
                key metric_name
                pattern /(network.rx_bytes|network.tx_bytes|network.rx_errors|network.tx_errors|cpu.usage_rate|memory.usage|memory.capacity)/
              </regexp>
- 透过 helm 部署到 OpenShift Cluster
$ helm install -f metrics_values.yaml splunk-metrics https://github.com/splunk/splunk-connect-for-kubernetes/releases/download/1.4.3/splunk-kubernetes-metrics-1.4.3.tgz
- 在 Splunk 搜寻 metrics 看是否有值,例如:
| mcatalog values(_dims) WHERE index="ocp_metrics" AND metric_name="kube.pod.cpu.load.average.10s"
部署 splunk-kubernetes-objects helm chart
- 客制化 values 值
最基本的 value 值范例:
splunk:
  hec:
    host: < splunk_host >
    port: 8088
    token: < splunk_hec_objects_token >
    indexName: < splunk_objects_indexname >
- 透过 helm 部署到 OpenShift Cluster
$ helm install -f objects_values.yaml splunk-objects https://github.com/splunk/splunk-connect-for-kubernetes/releases/download/1.4.3/splunk-kubernetes-objects-1.4.3.tgz
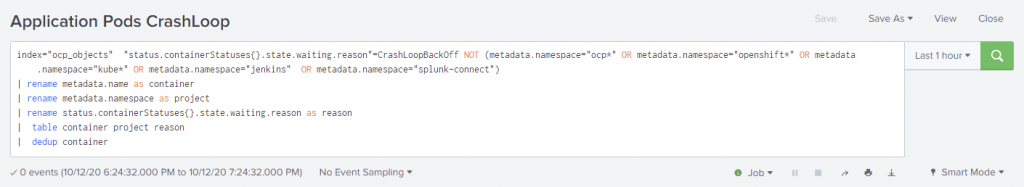
- 在 Splunk 搜寻 pods 状态,例如:
index="ocp_objects" metadata.namespace="splunk-connect" status.phase="Running" | stats distinct_count(metadata.uid)
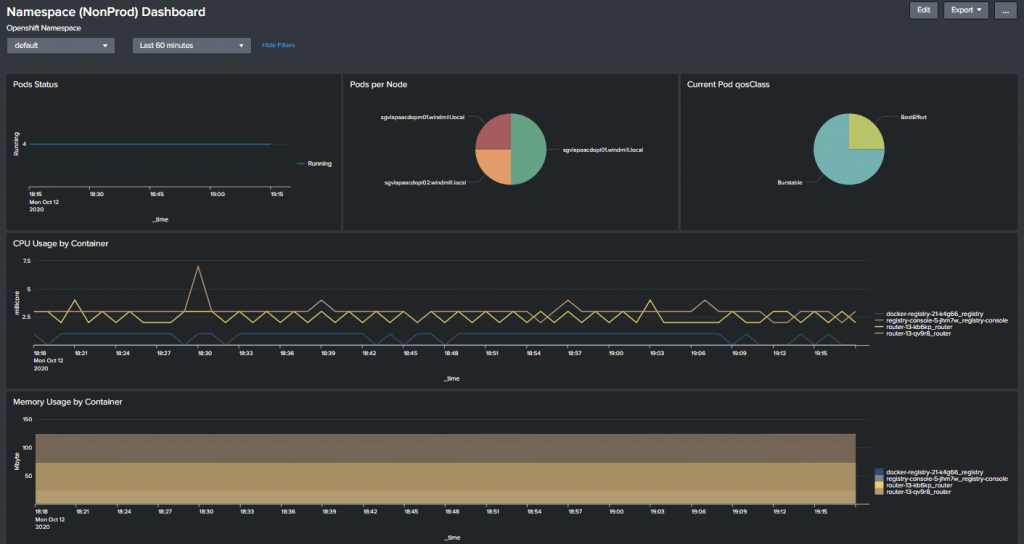
在 Splunk 建立客制化的 Dashboard 及 Alerts
Alerts:
Dashboard:
结论
目前只有看到 OUTCOLD 这家公司号称可以把应用程序的 prometheus metrics 转传到 Splunk,笔者还没有看到什麽 open source 解决方案,所以目前建议 logs 可以用 splunk,但其他的 metrics 监控还是用 OpenShift 内建的 Prometheus 跟 Grafana 比较适合。
虹语岚访仲夏夜-1(专业的小四篇)
R在旁边叫了我一声,「四先生,来看一下这个吧,我想到了。」 『这是啥?』 「地图啊......这是上...
Day33 | 赛後中场休息 X 复刊时间
赛後中场休息 X 复刊时间 大家好,我是韦恩,今天开始将会暂缓完赛後的系列的发文,复刊时间约在下下礼...
Day28 语法改革!零基础新手也能读懂的JS - JS30-16 Mouse Move Shadow
JS30官网 今天来讲解第十六天吧!这天会学到mousemvoe这个事件以及offset的用法 我们...
Day21 TensorFlow&OpenCV简介
我的目的 学习图像辨识,顺便拯救专题,再顺便参加铁人赛,一鱼三吃,真香。 图像辨识的原理 简单说就是...
Day01.从防疫特助到管道的故事谈Blue Prism
Blue Prism(蓝色棱镜),(後续也会穿插着简称BP)是属於RPA Robotic Proce...